
PUBLISHER: Mordor Intelligence | PRODUCT CODE: 2073075

PUBLISHER: Mordor Intelligence | PRODUCT CODE: 2073075
SDN-Enabled Switch - Market Share Analysis, Industry Trends & Statistics, Growth Forecasts (2026 - 2031)
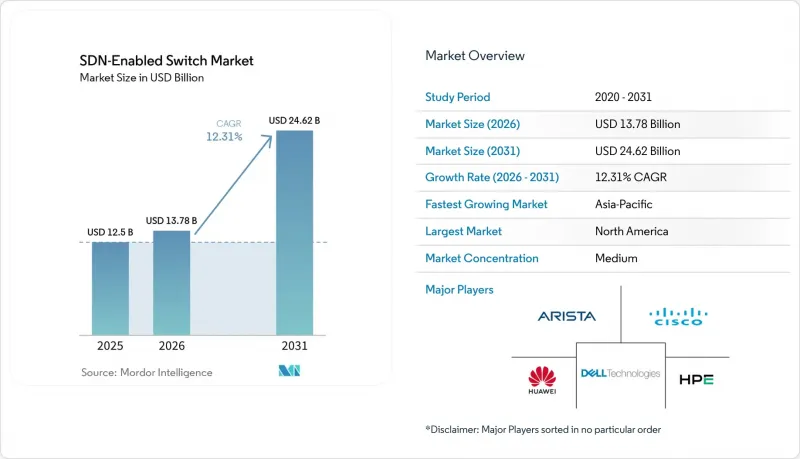
According to Mordor Intelligence, the SDN-enabled switch market size was valued at USD 12.5 billion in 2025 and estimated to grow from USD 13.78 billion in 2026 to reach USD 24.62 billion by 2031, at a CAGR of 12.31% during the forecast period (2026-2031).
This report is Segmented by SDN Implementation Type (Pure SDN, Hybrid SDN, and Overlay-Based SDN), Port Speed (1 GbE and Below, 2. 5/5 GbE Multi-Gig, 10 GbE, 25/40 GbE, 100 GbE, and More), Network Layer (Access, Distribution, and Core), End-User (Cloud and Data Center Providers, Enterprise, Telecommunication Service Providers, and More), and Geography. The Market Forecasts are Provided in Terms of Value (USD).
Global SDN-Enabled Switch Market Trends and Insights
Rapid Scalability Needs in Hyperscale Data Centers
Traffic surges triggered by large-language-model training often spike without notice, making fixed-function switches impractical. SDN-enabled hardware with telemetry-driven congestion control lets operators reassign thousands of 400 GbE links in seconds, sustaining GPU utilization above 90%. Meta's distributed switch fabric cut tail latency by 40% in clusters with more than 100,000 servers. Similarly, Google and Amazon committed to next-generation spine-leaf fabrics in new Texas and Minnesota campuses. These outcomes reinforce the view that software-defined control is a prerequisite for operating at exascale.
Surge in East-West Traffic Owing to Microservices Architectures
Microservices now produce roughly 80% of intra-data-center packets, reversing the client-server model that dominated past decades. Legacy three-tier networks buckle under the chatter of service meshes that orchestrate hundreds of ephemeral pods. SDN-enabled spine-leaf designs offer non-blocking bandwidth and equal-cost multipath routing, preventing oversubscription bottlenecks. Kubernetes passed 5.6 million production clusters by mid-2025, each requiring policy enforcement that references pod labels, not static IP addresses. Open-source NOS options such as SONiC, integrated with Vector Packet Processing, process 100 million packets per second at sub-10 microsecond jitter, delivering carrier-grade performance without proprietary ASICs.
Complexity of Integrating Legacy Network Management Tools
Legacy tools such as HP Network Node Manager and SolarWinds Network Performance Monitor rely on SNMP polling and syslog parsing, which cannot capture the sub-second telemetry streams that SDN controllers require for real-time policy enforcement. Migration projects frequently stall when operators discover that existing change-management workflows, built around manual configuration templates and approval chains, cannot accommodate the intent-based abstractions that SDN platforms expose. A 2025 survey of 340 network architects found that 62% cited integration complexity as the primary barrier to SDN adoption, ahead of budget constraints or vendor lock-in concerns.
Other drivers and restraints analyzed in the detailed report include:
- Network Automation Mandates to Lower OPEX
- Adoption of White-Box Switches by Tier-1 Cloud Providers
- Limited Skilled Workforce for SDN Programming Languages
For complete list of drivers and restraints, kindly check the Table Of Contents.
Segment Analysis
Hybrid designs accounted for 48.72% of the SDN-enabled switch market share in 2025, as they allow operators to keep familiar OSPF and BGP processes alongside OpenFlow or NETCONF policies. This coexistence lowers the perceived risk of controller outages. Pure SDN switches, projected to grow at a 13.84% CAGR through 2031, gain traction in greenfield hyperscale campuses where no legacy tooling exists. The SDN-enabled switch market size for pure deployments is set to expand rapidly as NVIDIA Spectrum-4 and Arista 7060X6 platforms prove that centralized control can match proprietary features at line rate. Overlay-based variants, reliant on VXLAN or NVGRE, remain a bridge solution for branches and campuses constrained by hardware refreshes.
The gradual shift from dual-stack hybrids to pure SDN echoes the IPv4-to-IPv6 migration: early adopters absorb added complexity for a future of leaner operations. Arista's P4-programmable pipelines enable operators to embed workload-specific telemetry, underscoring how software freedom, not port density, will differentiate next-generation silicons. Overlay appliances still retain importance where compliance frameworks such as PCI-DSS forbid large-scale hardware swaps, yet their share will decline once controller resilience myths fade.
The 25/40 GbE tier delivered 27.91% revenue in 2025, underpinned by enterprise top-of-rack refreshes. However, 400 GbE and above will accelerate at an 18.63% CAGR as AI factories saturate 200 Gbps-per-GPU thresholds. The SDN-enabled switch market size for 400 GbE spines is climbing fastest in North America and Asia-Pacific, where Juniper QFX5230 and Dell PowerSwitch Z9864F dominate new designs. Meanwhile, 1 GbE persists at the edge in industrial gateways, and 100 GbE balances cost versus density for database replication clusters.
Vendors already sample 800 GbE and 1.6 TbE line cards standardized under IEEE 802.3ck, preparing for post-2027 ramps once optics prices fall. NVIDIA's Spectrum-SN5600 couples 64-port 400 GbE blocks with GPU-aware congestion control, hinting at a wave of workload-optimized silicon in place of generic port-count races. Additionally, ecosystem readiness across optics, cabling, and ASIC supply chains will be critical to accelerate commercialization timelines.
Complete Report Scope:
- By SDN Implementation Type
- Pure SDN Switches
- Hybrid SDN Switches
- Overlay-based SDN Switches
- By Port Speed
- 1 GbE and Below
- 2.5/5 GbE Multi-Gig
- 10 GbE
- 25/40 GbE
- 100 GbE
- 400 GbE and Above
- By Network Layer
- Access
- Distribution
- Core
- By End User
- Cloud and Data Center Providers
- Enterprise (Commercial Offices and Campuses)
- Telecommunication Service Providers
- Government and Defense
- Other End Users
- By Geography
- North America
- United States
- Canada
- Mexico
- South America
- Brazil
- Argentina
- Rest of South America
- Europe
- Germany
- United Kingdom
- France
- Italy
- Spain
- Russia
- Rest of Europe
- Asia-Pacific
- China
- Japan
- India
- South Korea
- Australia and New Zealand
- Rest of Asia-Pacific
- Middle East
- Saudi Arabia
- United Arab Emirates
- Turkey
- Rest of Middle East
- Africa
- South Africa
- Nigeria
- Rest of Africa
- North America
Geography Analysis
North America contributed 36.84% of 2025 revenue, anchored by more than USD 400 billion in hyperscale data-center spending across Virginia, Oregon, Texas, and Iowa. Continuous capacity additions and early adoption of 400 GbE fabrics place the region at the forefront of software-defined switching deployments for AI and cloud workloads. Stringent federal programs such as the United States Air Force's Enterprise IT CONNECT further expand demand for programmable infrastructure in campus and wide-area domains.
Asia-Pacific is forecast to post a 15.94% CAGR through 2031, propelled by India's plan to lift installed IT load from just above 2 GW in 2026 toward 8 GW by the early 2030s. Hyperscalers led by Google, Microsoft, and Amazon have committed more than USD 40 billion to the country, funneling switch orders to white-box original design manufacturers and branded incumbents alike. China remains the single-largest national market inside the region, where government mandates for domestically designed networking stacks favor Huawei, H3C, and Ruijie.
Europe advances at a steadier clip as fragmented data-sovereignty rules require localized infrastructure in each member state, adding cost and elongating refresh cycles. Even so, the NIS2 Directive, effective October 2024, obliges operators to centralize network visibility and policy, which aligns with SDN's single-pane orchestration model. The Middle East and Africa, though smaller in revenue, are seeing first-wave commercial 5G-Advanced slicing projects that rely on SDN controllers to assure end-to-end quality of service, while South America shows early momentum as Brazil welcomes new cloud regions from AWS and Microsoft.
- Arista Networks Inc.
- Cisco Systems Inc.
- Hewlett Packard Enterprise Company
- Dell Technologies Inc.
- Huawei Technologies Co. Ltd.
- NEC Corporation
- Extreme Networks Inc.
- NVIDIA Corporation (Mellanox Technologies)
- Edgecore Networks Corporation
- Cumulus Networks LLC
- Pica8 Inc.
- NoviFlow Inc.
- Centec Networks Co. Ltd.
- Quanta Cloud Technology LLC
- Pluribus Networks Inc.
- Volta Networks Inc.
- Barefoot Networks Inc.
- Fortinet Inc.
- Ruijie Networks Co. Ltd.
- ZTE Corporation
- MikroTik SIA
- Radisys Corporation
Additional Benefits:
- The market estimate (ME) sheet in Excel format
- 3 months of analyst support
TABLE OF CONTENTS
1 INTRODUCTION
- 1.1 Study Assumptions and Market Definition
- 1.2 Scope of the Study
2 RESEARCH METHODOLOGY
3 EXECUTIVE SUMMARY
4 MARKET LANDSCAPE
- 4.1 Market Overview
- 4.2 Market Drivers
- 4.2.1 Rapid Scalability Needs in Hyperscale Data Centers
- 4.2.2 Surge in East-West Traffic Owing to Micro-services Architectures
- 4.2.3 Network Automation Mandates to Lower OPEX
- 4.2.4 Adoption of White-Box Switches by Tier-1 Cloud Providers
- 4.2.5 Disaggregation Trend Enabled by Open Compute Project
- 4.2.6 Government Initiatives Funding 5G Transport Networks
- 4.3 Market Restraints
- 4.3.1 Complexity of Integrating Legacy Network Management Tools
- 4.3.2 Limited Skilled Workforce for SDN Programming Languages
- 4.3.3 Perceived Security Risks around Centralised Controllers
- 4.3.4 Vendor Interoperability Gaps in Southbound APIs
- 4.4 Industry Value Chain Analysis
- 4.5 Regulatory Landscape
- 4.6 Technological Outlook
- 4.7 Impact of Macroeconomic Factors on the Market
- 4.8 Porter's Five Forces Analysis
- 4.8.1 Threat of New Entrants
- 4.8.2 Bargaining Power of Suppliers
- 4.8.3 Bargaining Power of Buyers
- 4.8.4 Threat of Substitutes
- 4.8.5 Intensity of Competitive Rivalry
5 MARKET SIZE AND GROWTH FORECASTS (VALUE)
- 5.1 By SDN Implementation Type
- 5.1.1 Pure SDN Switches
- 5.1.2 Hybrid SDN Switches
- 5.1.3 Overlay-based SDN Switches
- 5.2 By Port Speed
- 5.2.1 1 GbE and Below
- 5.2.2 2.5/5 GbE Multi-Gig
- 5.2.3 10 GbE
- 5.2.4 25/40 GbE
- 5.2.5 100 GbE
- 5.2.6 400 GbE and Above
- 5.3 By Network Layer
- 5.3.1 Access
- 5.3.2 Distribution
- 5.3.3 Core
- 5.4 By End User
- 5.4.1 Cloud and Data Center Providers
- 5.4.2 Enterprise (Commercial Offices and Campuses)
- 5.4.3 Telecommunication Service Providers
- 5.4.4 Government and Defense
- 5.4.5 Other End Users
- 5.5 By Geography
- 5.5.1 North America
- 5.5.1.1 United States
- 5.5.1.2 Canada
- 5.5.1.3 Mexico
- 5.5.2 South America
- 5.5.2.1 Brazil
- 5.5.2.2 Argentina
- 5.5.2.3 Rest of South America
- 5.5.3 Europe
- 5.5.3.1 Germany
- 5.5.3.2 United Kingdom
- 5.5.3.3 France
- 5.5.3.4 Italy
- 5.5.3.5 Spain
- 5.5.3.6 Russia
- 5.5.3.7 Rest of Europe
- 5.5.4 Asia-Pacific
- 5.5.4.1 China
- 5.5.4.2 Japan
- 5.5.4.3 India
- 5.5.4.4 South Korea
- 5.5.4.5 Australia and New Zealand
- 5.5.4.6 Rest of Asia-Pacific
- 5.5.5 Middle East
- 5.5.5.1 Saudi Arabia
- 5.5.5.2 United Arab Emirates
- 5.5.5.3 Turkey
- 5.5.5.4 Rest of Middle East
- 5.5.6 Africa
- 5.5.6.1 South Africa
- 5.5.6.2 Nigeria
- 5.5.6.3 Rest of Africa
- 5.5.1 North America
6 COMPETITIVE LANDSCAPE
- 6.1 Market Concentration
- 6.2 Strategic Moves
- 6.3 Market Share Analysis
- 6.4 Company Profiles (includes Global Level Overview, Market Level Overview, Core Segments, Financials as available, Strategic Information, Market Rank/Share, Products and Services, Recent Developments)
- 6.4.1 Arista Networks Inc.
- 6.4.2 Cisco Systems Inc.
- 6.4.3 Hewlett Packard Enterprise Company
- 6.4.4 Dell Technologies Inc.
- 6.4.5 Huawei Technologies Co. Ltd.
- 6.4.6 NEC Corporation
- 6.4.7 Extreme Networks Inc.
- 6.4.8 NVIDIA Corporation (Mellanox Technologies)
- 6.4.9 Edgecore Networks Corporation
- 6.4.10 Cumulus Networks LLC
- 6.4.11 Pica8 Inc.
- 6.4.12 NoviFlow Inc.
- 6.4.13 Centec Networks Co. Ltd.
- 6.4.14 Quanta Cloud Technology LLC
- 6.4.15 Pluribus Networks Inc.
- 6.4.16 Volta Networks Inc.
- 6.4.17 Barefoot Networks Inc.
- 6.4.18 Fortinet Inc.
- 6.4.19 Ruijie Networks Co. Ltd.
- 6.4.20 ZTE Corporation
- 6.4.21 MikroTik SIA
- 6.4.22 Radisys Corporation
7 MARKET OPPORTUNITIES AND FUTURE OUTLOOK
- 7.1 White-Space and Unmet-Need Assessment

