
PUBLISHER: Mordor Intelligence | PRODUCT CODE: 2073535

PUBLISHER: Mordor Intelligence | PRODUCT CODE: 2073535
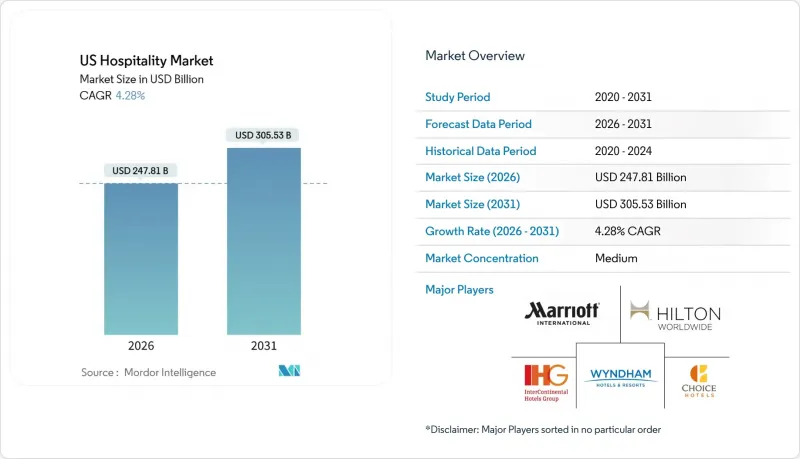
US Hospitality - Market Share Analysis, Industry Trends & Statistics, Growth Forecasts (2026 - 2031)
According to Mordor Intelligence, the united states hospitality market stands at USD 247.81 billion in 2026 and is projected to reach USD 305.53 billion by 2031, expanding at a 4.28% CAGR.
This report is Segmented by Type (Chain Hotels, and Independent Hotels), by Accommodation Class (Luxury, Mid & Upper-Midscale Hotels, Budget & Economy, and Service Apartments), by Booking Channel (Direct Digital, Otas, Corporate/MICE, Wholesale & Traditional Agents), and Geography (Northeast, Southeast, Midwest, Southwest, West). The Market Forecasts are Provided in Terms of Value (USD).
US Hospitality Market Trends and Insights
Strong Domestic Travel Demand
Domestic leisure spending remained a bright spot in 2025, with United States Travel indicating that outlays held firm as consumers prioritized trip plans and experiences despite broader cost pressures that affected discretionary budgets. Systemwide airline enplanements reached 76.8 million in September 2025, which reflects normalized travel patterns and an air demand base that helps support year-round lodging activity across primary and secondary markets. Security checkpoint throughput surpassed 2.8 million daily passengers at several points in early January 2026, signalling sustained momentum at the start of the year and a positive read-through for short-haul and city-weekend lodging demand within the United States hospitality market. As travel normalized, spending composition shifted more toward experiences and premium on-property offerings, which supported rate integrity in better-positioned assets that invest in wellness, dining, and cultural programming. This demand base helped stabilize the USA hospitality market through periods of economic uncertainty, with network effects from air capacity and road-trip patterns continuing to disperse travellers beyond traditional gateway hubs.
Digitalization and Online Booking
Mobile-first booking has become the prevailing workflow for hotel reservations, and hoteliers who align merchandising and UX to mobile journeys see higher conversion and better return on media spend. Direct engines benefit when loyalty rates are visible, when cart design reduces friction, and when retailing of add-ons is integrated at search and checkout, which supports a stronger direct mix in the United States hospitality market. Industry associations also point to digital drivers like personalization, first-party data capture, and optimized metasearch participation as core to sustaining owned bookings that reduce intermediary costs. As distribution stacks evolve into platform ecosystems, property teams apply layered tools for pricing, content, and retailing that integrate with PMS and CRM, which strengthens data-driven decisions across the customer journey. This digitalization trend supports the hospitality industry in the USA by improving the economics of demand capture and by enabling targeted offers that grow revenue per guest without sacrificing rate strategy.
Elevated Labor Costs & Shortages in Gateway Markets
The leisure and hospitality sector continued to experience above-average unemployment rates relative to the overall economy at several points during 2025, which underscores ongoing frictions in hiring and retention across core property functions. Industry surveys point to persistent staffing shortages in hotels, with many operators citing housekeeping and guest services as the most difficult roles to fill. Wage growth and compliance complexity in high-cost cities raise operating baselines, which compress margins when room revenue growth is modest and when occupancy ebbs seasonally inside the United States hospitality market. Operators have responded with productivity improvements and targeted automation in back-of-house and guest-facing workflows, but the pace of cost relief depends on sustained gains in staffing stability and training outcomes. These labour dynamics remain most pronounced in gateway metros with higher minimum wages and scheduling requirements, which adds execution risk to independent assets with smaller teams and limited purchasing leverage.
Other drivers and restraints analyzed in the detailed report include:
- Short-Term Rentals and Hybrid Models
- Infrastructure and Airport Expansion
- Rising Insurance & Climate-Risk Premiums for Coastal Properties
For complete list of drivers and restraints, kindly check the Table Of Contents.
Segment Analysis
Independent hotels held 63.38% of the base in 2025, while chain hotels are projected to grow at 7.73% through 2031, indicating that the United States hospitality market size by brand affiliation is shifting as conversions accelerate and brand systems demonstrate stronger demand capture. Brands support owners with reservation engines, loyalty ecosystems, and sales platforms that improve exposure to high-yield segments, which encourages independent owners to consider soft-brand options that preserve identity with lower transition friction. Global operators emphasize asset-light models that favour franchise and management contracts, creating scalable networks where brand standards and procurement leverage expand profitability over time for participating properties. The extended-stay category remains a resilient bridge between hotel and rental demand, and its flexible length-of-stay mix helps stabilize occupancy during shoulder periods in the United States hospitality market. As capital remains selective, the combination of conversion-readiness and loyalty access is likely to tilt owner decisions toward brands that offer speed to revenue and balanced franchise terms.
Conversion economics benefit most where brand systems can lift visibility in corporate channels and reduce distribution costs through direct marketing at scale, which can offset franchise fees through stronger occupancy and rate. Companies that reported a high proportion of openings from conversions highlighted owner demand for flexible collections that retain local character while unlocking global demand pools. Independent operators still compete effectively where product differentiation and local partnerships generate premium ADRs, although many are adopting digital tools for pricing, CRM, and retailing to protect share within the United States hospitality market. Extended-stay brands deepen their footprint by serving project crews, relocating families, and medical travel, which diversifies the mix and reduces cyclicality for both branded and independent portfolios. In the forecast window, the gap between brand and independent growth narrows as more independents adopt soft brands and as brands refine owner economics for sub-300-room conversions in secondary and tertiary markets.
Complete Report Scope:
- By Type
- Chain Hotels
- Independent Hotels
- By Accommodation Class
- Luxury
- Mid & Upper-Midscale Hotels
- Budget & Economy
- Service Apartments
- By Booking Channel
- Direct Digital
- OTAs
- Corporate/MICE
- Wholesale & Traditional Agents
- By Geography
- Northeast
- Southeast
- Midwest
- Southwest
- West
List of Companies Covered in this Report:
- Marriott International
- Hilton Worldwide Holdings
- Wyndham Hotels & Resorts
- InterContinental Hotels Group (IHG)
- Choice Hotels International
- Hyatt Hotels Corporation
- Best Western Hotels & Resorts
- G6 Hospitality (Motel 6 / Studio 6)
- Extended Stay America
- Aimbridge Hospitality
- Accor SA (U.S. operations)
- Red Roof Inn
- Drury Hotels Company
- Four Seasons Hotels & Resorts
- Airbnb Inc.
- Host Hotels & Resorts (REIT)
- Pebblebrook Hotel Trust
- Apple Hospitality REIT
- DiamondRock Hospitality
- Sonesta International Hotels
- MGM Resorts International
- Loews Hotels
Additional Benefits:
- The market estimate (ME) sheet in Excel format
- 3 months of analyst support
TABLE OF CONTENTS
1 Introduction
- 1.1 Study Assumptions & Market Definition
- 1.2 Scope of the Study
2 Research Methodology
3 Executive Summary
4 Market Landscape
- 4.1 Market Overview
- 4.2 Market Drivers
- 4.2.1 Strong Domestic Travel Demand
- 4.2.2 Digitalization and Online Booking
- 4.2.3 Short-Term Rentals and Hybrid Models
- 4.2.4 Experience-Driven Travel
- 4.2.5 Infrastructure and Airport Expansion
- 4.2.6 Government Support & Incentives
- 4.3 Market Restraints
- 4.3.1 Elevated Labor Costs & Shortages in Gateway Markets
- 4.3.2 Rising Insurance & Climate-Risk Premiums for Coastal Properties
- 4.3.3 High Interest Rates Constraining Sub-300-Room New-Build Financing
- 4.3.4 Regulatory Crack-down on Short-Term Rentals Compressing RevPAR
- 4.4 Regulatory Outlook
- 4.5 Technological Outlook
- 4.6 Porter's Five Forces
- 4.6.1 Threat of New Entrants
- 4.6.2 Bargaining Power of Buyers
- 4.6.3 Bargaining Power of Suppliers
- 4.6.4 Threat of Substitutes
- 4.6.5 Intensity of Competitive Rivalry
5 Market Size & Growth Forecasts (Value)
- 5.1 By Type
- 5.1.1 Chain Hotels
- 5.1.2 Independent Hotels
- 5.2 By Accommodation Class
- 5.2.1 Luxury
- 5.2.2 Mid & Upper-Midscale Hotels
- 5.2.3 Budget & Economy
- 5.2.4 Service Apartments
- 5.3 By Booking Channel
- 5.3.1 Direct Digital
- 5.3.2 OTAs
- 5.3.3 Corporate/MICE
- 5.3.4 Wholesale & Traditional Agents
- 5.4 By Geography
- 5.4.1 Northeast
- 5.4.2 Southeast
- 5.4.3 Midwest
- 5.4.4 Southwest
- 5.4.5 West
6 Competitive Landscape
- 6.1 Market Concentration
- 6.2 Strategic Moves
- 6.3 Market Share Analysis
- 6.4 Company Profiles {(includes Global level Overview, Market level overview, Core Segments, Financials as available, Strategic Information, Market Rank/Share for key companies, Products & Services, and Recent Developments)}
- 6.4.1 Marriott International
- 6.4.2 Hilton Worldwide Holdings
- 6.4.3 Wyndham Hotels & Resorts
- 6.4.4 InterContinental Hotels Group (IHG)
- 6.4.5 Choice Hotels International
- 6.4.6 Hyatt Hotels Corporation
- 6.4.7 Best Western Hotels & Resorts
- 6.4.8 G6 Hospitality (Motel 6 / Studio 6)
- 6.4.9 Extended Stay America
- 6.4.10 Aimbridge Hospitality
- 6.4.11 Accor SA (U.S. operations)
- 6.4.12 Red Roof Inn
- 6.4.13 Drury Hotels Company
- 6.4.14 Four Seasons Hotels & Resorts
- 6.4.15 Airbnb Inc.
- 6.4.16 Host Hotels & Resorts (REIT)
- 6.4.17 Pebblebrook Hotel Trust
- 6.4.18 Apple Hospitality REIT
- 6.4.19 DiamondRock Hospitality
- 6.4.20 Sonesta International Hotels
- 6.4.21 MGM Resorts International
- 6.4.22 Loews Hotels
7 Market Opportunities & Future Outlook
- 7.1 Expansion of Tech?Enabled Guest Experiences and Operational Efficiency
- 7.2 Growth in Experiential and Sustainable Travel Demand

