
PUBLISHER: Mordor Intelligence | PRODUCT CODE: 2073538

PUBLISHER: Mordor Intelligence | PRODUCT CODE: 2073538
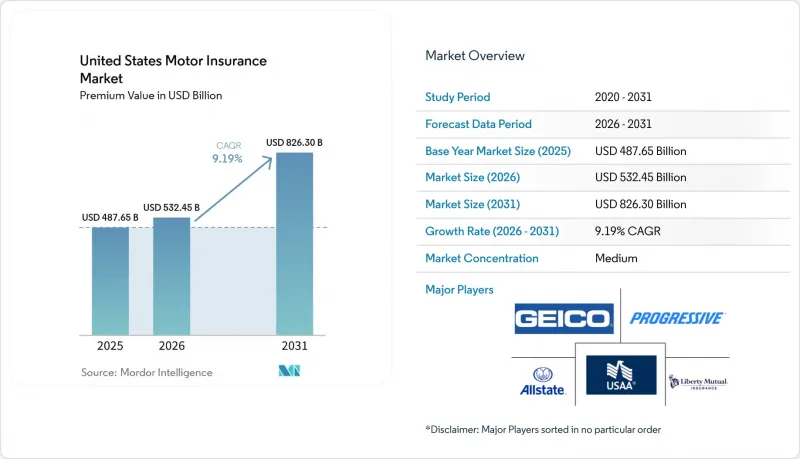
United States Motor Insurance - Market Share Analysis, Industry Trends & Statistics, Growth Forecasts (2026 - 2031)
According to Mordor Intelligence, the united states motor insurance market size in terms of premium value is projected to expand from USD 487.65 billion in 2025 and USD 532.45 billion in 2026 to USD 826.30 billion by 2031, registering a CAGR of 9.19% between 2026 to 2031.
This report is Segmented by Coverage Type (Liability, Collision, Comprehensive, Others), Vehicle Type (Passenger Cars, Light Commercial Vehicles, Others), Policy Type (Personal Motor Insurance, Commercial Motor Insurance), Distribution Channel (Agency Channel, Direct Response, Others), and Geography (Northeast, Midwest, South, West). The Market Forecasts are Provided in Terms of Value (USD).
United States Motor Insurance Market Trends and Insights
Rising Severity & Frequency of Auto Accidents in Urban Corridors
Traffic fatalities fell 8.2% in the first half of 2025 to 17,140 deaths, and the fatality rate per 100 million vehicle miles travelled declined to 1.06, the lowest mid-year level since 2014, while urban corridors still present elevated risk concentrations that pressure pricing and claims handling . Bodily injury claim severity continued to rise, with the average third-party bodily injury payout reaching USD 29,900 per injured party in the second quarter of 2025, up 9.6% from the second quarter of 2024. As of the second quarter of 2025, bodily injury indemnity accounted for 52% of all liability dollars paid, highlighting the shift toward casualty exposure in insurer loss costs. Work zone crashes show higher rear-end involvement and noticeable links to distraction compared to non-work zone crashes, heightening attention to roadway context and time-of-day patterns in pricing models. Carriers are tightening underwriting, expanding telematics-based risk scoring, and deploying advanced analytics to refine urban exposure segmentation as the United States motor insurance market seeks sustained loss ratio improvement.
Higher Vehicle Transaction Prices Elevating Insured Values
Average new vehicle selling prices exceeded USD 50,000 in the third quarter of 2025, while new loans averaged USD 42,600 at 7% APR, and used loans averaged around USD 30,000 at nearly 11% APR, changes that lift insured values and premium needs for physical damage coverages. Parts inflation moved from around 7% in August 2025 to 9% to 10% in September 2025, adding pressure to claim severity in collision and comprehensive lines. The Bureau of Labor Statistics continues to flag elevated cost levels across motor-vehicle-related categories, reinforcing the inflationary backdrop for claim costs and policy pricing. Negative equity on trade-ins rose to 28% in the third quarter of 2025, and repossessions reached their highest level in 15 years, developments that can influence coverage selections and gap-related protections. Claims analytics teams continue to factor these cost layers into rating and reserving practices to keep pace with shifting severity dynamics.
Cat-Loss Volatility from Severe Weather in Coastal States
The United States recorded 27 billion-dollar weather and climate disasters in 2024 with total costs of USD 182.7 billion, reflecting a sustained pattern of severe convective storms, tropical cyclones, and other extremes that shape premium and capacity decisions in coastal states. Global insured catastrophe losses were elevated in 2025, and the early 2025 Palisades Fire in Southern California was reported as the costliest wildfire event on record globally with USD 40 billion in insured losses, underscoring the volatility facing carriers with Western exposure. Insurers have responded by tightening underwriting appetites in certain high-risk areas and revisiting reinsurance arrangements, which influence rate actions and product availability for households and small businesses. Catastrophe modelling and granular geospatial analytics remain central to capacity deployment and deductible strategies in the South and West. These volatility dynamics feed directly into comprehensive pricing and coverage terms across the United States motor insurance market.
Other drivers and restraints analyzed in the detailed report include:
- Embedded Insurance Partnerships with OEMs & Digital Dealers
- AI-Driven Claims Automation Lowering LAE
- Rate-Filing Caps & Delays in CA and NY
For complete list of drivers and restraints, kindly check the Table Of Contents.
Segment Analysis
Liability coverage held 64.39% of the United States motor insurance market in 2025, as state minimum limits and rising injury severity continue to elevate liability exposure for carriers and policyholders. The increase in minimum bodily injury limits in California, effective January 2025, illustrates how regulation supports higher coverage adoption and larger limit selection for households and small fleets. The average third-party bodily injury payout rose to USD 29,900 per injured party in the second quarter of 2025, a 9.6% year-over-year increase that influences liability rate filings and reserve practices across the United States motor insurance market. Comprehensive coverage growth is supported by catastrophe volatility, with the nation experiencing 27 billion-dollar weather and climate events in 2024 and sustained severe storm activity that lifts physical damage claims. Collision premiums remain sensitive to repair complexity, as average repair costs approached USD 5,000 in the third quarter of 2025, and calibration requirements increased with the spread of advanced driver assistance technologies.
Comprehensive is projected to be the fastest-growing coverage line at a 6.77% CAGR to 2031 as climate-driven events and vehicle technology costs reinforce the case for broad physical damage protection in the United States motor insurance industry. Personal injury protection and uninsured or underinsured motorist coverages are expanding in jurisdictions with affordability challenges and high litigation risk, informed by federal and state analyses of market behaviour and consumer protections. The calibration burden from advanced driver assistance systems is altering severity for both collision and comprehensive claims, which encourages carriers to steer repairs into certified facilities and to adjust labour allowances and parts sourcing strategies. These shifts underpin a more granular coverage mix as the United States motor insurance market aligns pricing and product options with loss experience and regulatory obligations.
Passenger cars accounted for the largest share of the United States motor insurance market in 2025, supported by a car parc exceeding 295 million vehicles in the second quarter of 2025 and an average vehicle age of 12.7 years that shapes repair and replacement dynamics. Commercial fleets in light and heavy commercial vehicle categories face elevated frequency and severity risk, but the rate environment in 2026 is moderating, with many insureds seeing increases in the 10% to 15% range compared to the 20%-plus hikes common in recent years. Motorcycle policies are posting the fastest growth within vehicle types on the back of leisure demand and specialized coverage options that focus on accessories and seasonal usage patterns. Specialty and recreational vehicles add niche opportunities as underwriters tune products for collector, off-road, and limited-use risk profiles, which call for precise valuation and agreed value options. Electric and hybrid vehicles accounted for a rising share of repairable claims among newer vehicles in 2025, introducing distinct labour and parts requirements for claims operations in the United States motor insurance market.
The United States motor insurance market size for motorcycles is projected to expand at a 7.39% CAGR between 2026 and 2031 as product breadth and pricing sophistication improve in line with rider demographics and seasonality. Commercial fleet growth and safety technology mandates are propelling the adoption of telematics, GPS tracking, dash cameras, and maintenance documentation that are increasingly expected by underwriters in their risk reviews. EV repair demands nearly 4 additional labour hours and higher labour costs versus internal combustion vehicles, and the parts count per repair also differs, which changes the claims cost structure at the vehicle line level. Insurers are refining total loss thresholds and certified network strategies to mitigate cycle time and improve outcomes for high-tech vehicle segments across the United States motor insurance market. These shifts suggest vehicle type risk segmentation will continue to evolve as fleet electrification, ADAS penetration, and niche segments reshape loss patterns in the United States motor insurance industry.
Complete Report Scope:
- By Coverage Type
- Liability
- Collision
- Comprehensive
- Personal Injury Protection (PIP)
- Uninsured / Under-insured Motorist
- By Vehicle Type
- Passenger Cars
- Light Commercial Vehicles
- Heavy Commercial Vehicles
- Motorcycles
- Specialty & Recreational Vehicles
- By Policy Type
- Personal Motor Insurance
- Commercial Motor Insurance
- By Distribution Channel
- Agency Channel
- Independent Agents
- Captive/Exclusive Agents
- Direct Response (Company-Owned)
- Bancassurance & Affinity Partnerships
- Digital / Insurtech Platforms
- Agency Channel
- By US Region
- Northeast
- Midwest
- South
- West
List of Companies Covered in this Report:
- State Farm Mutual Automobile Insurance Co.
- GEICO (Berkshire Hathaway Inc.)
- Progressive Corp.
- Allstate Corp.
- United Services Automobile Association (USAA)
- Liberty Mutual Holding Co. Inc.
- Farmers Insurance Group (Zurich)
- Nationwide Mutual Insurance Co.
- American Family Insurance
- Travelers Companies Inc.
- Erie Indemnity Co.
- Auto-Owners Insurance Group
- The Hartford Financial Services Group
- CSAA Insurance Group
- Kemper Corp.
- Amica Mutual Insurance Co.
- Root Inc.
- Lemonade Inc. (Metromile)
- Chubb Ltd.
- AXA XL (Commercial Auto)
- Tokio Marine (Philadelphia Insurance)
- Zurich North America
- Sentry Insurance
- Markel Corp.
- Assurant Inc.
Additional Benefits:
- The market estimate (ME) sheet in Excel format
- 3 months of analyst support
TABLE OF CONTENTS
1 Introduction
- 1.1 Study Assumptions & Market Definition
- 1.2 Scope of the Study
2 Research Methodology
3 Executive Summary
4 Market Landscape
- 4.1 Market Overview
- 4.2 Market Drivers
- 4.2.1 Rising Severity & Frequency of Auto Accidents in Urban Corridors
- 4.2.2 Regulatory Approval of Telematics-Based UBI Across 48 States
- 4.2.3 Higher Vehicle Transaction Prices Elevating Insured Values
- 4.2.4 Growth of EV Fleet Driving Specialized Coverages
- 4.2.5 Embedded Insurance Partnerships with OEMs & Digital Dealers
- 4.2.6 AI-Driven Claims Automation Lowering LAE
- 4.3 Market Restraints
- 4.3.1 Margin Compression from Direct-Writer Insurtechs
- 4.3.2 Rising Repair Costs for ADAS-Equipped Vehicles
- 4.3.3 Cat-Loss Volatility from Severe Weather in Coastal States
- 4.3.4 Rate-Filing Caps & Delays in CA and NY
- 4.4 Value / Supply-Chain Analysis
- 4.5 Regulatory or Technological Outlook
- 4.6 Porter's Five Forces
- 4.6.1 Threat of New Entrants
- 4.6.2 Bargaining Power of Buyers
- 4.6.3 Bargaining Power of Suppliers
- 4.6.4 Threat of Substitutes
- 4.6.5 Industry Rivalry
5 Market Size & Growth Forecasts (Value)
- 5.1 By Coverage Type
- 5.1.1 Liability
- 5.1.2 Collision
- 5.1.3 Comprehensive
- 5.1.4 Personal Injury Protection (PIP)
- 5.1.5 Uninsured / Under-insured Motorist
- 5.2 By Vehicle Type
- 5.2.1 Passenger Cars
- 5.2.2 Light Commercial Vehicles
- 5.2.3 Heavy Commercial Vehicles
- 5.2.4 Motorcycles
- 5.2.5 Specialty & Recreational Vehicles
- 5.3 By Policy Type
- 5.3.1 Personal Motor Insurance
- 5.3.2 Commercial Motor Insurance
- 5.4 By Distribution Channel
- 5.4.1 Agency Channel
- 5.4.1.1 Independent Agents
- 5.4.1.2 Captive/Exclusive Agents
- 5.4.2 Direct Response (Company-Owned)
- 5.4.3 Bancassurance & Affinity Partnerships
- 5.4.4 Digital / Insurtech Platforms
- 5.4.1 Agency Channel
- 5.5 By US Region
- 5.5.1 Northeast
- 5.5.2 Midwest
- 5.5.3 South
- 5.5.4 West
6 Competitive Landscape
- 6.1 Market Concentration
- 6.2 Strategic Moves
- 6.3 Market Share Analysis
- 6.4 Company Profiles {(includes Global level Overview, Market level overview, Core Segments, Financials as available, Strategic Information, Market Rank/Share for key companies, Products & Services, and Recent Developments)}
- 6.4.1 State Farm Mutual Automobile Insurance Co.
- 6.4.2 GEICO (Berkshire Hathaway Inc.)
- 6.4.3 Progressive Corp.
- 6.4.4 Allstate Corp.
- 6.4.5 United Services Automobile Association (USAA)
- 6.4.6 Liberty Mutual Holding Co. Inc.
- 6.4.7 Farmers Insurance Group (Zurich)
- 6.4.8 Nationwide Mutual Insurance Co.
- 6.4.9 American Family Insurance
- 6.4.10 Travelers Companies Inc.
- 6.4.11 Erie Indemnity Co.
- 6.4.12 Auto-Owners Insurance Group
- 6.4.13 The Hartford Financial Services Group
- 6.4.14 CSAA Insurance Group
- 6.4.15 Kemper Corp.
- 6.4.16 Amica Mutual Insurance Co.
- 6.4.17 Root Inc.
- 6.4.18 Lemonade Inc. (Metromile)
- 6.4.19 Chubb Ltd.
- 6.4.20 AXA XL (Commercial Auto)
- 6.4.21 Tokio Marine (Philadelphia Insurance)
- 6.4.22 Zurich North America
- 6.4.23 Sentry Insurance
- 6.4.24 Markel Corp.
- 6.4.25 Assurant Inc.
7 Market Opportunities & Future Outlook
- 7.1 Adoption of Telematics and Usage-Based Insurance (UBI)
- 7.2 Expansion of Digital Platforms and Insurtech Innovations

