PUBLISHER: Mordor Intelligence | PRODUCT CODE: 2097210

PUBLISHER: Mordor Intelligence | PRODUCT CODE: 2097210
United States Coworking Office Space - Market Share Analysis, Industry Trends & Statistics, Growth Forecasts (2026 - 2031)
According to Mordor Intelligence, the United States coworking office space market size in 2026 is estimated at USD 5.38 billion, growing from 2025 value of USD 4.99 billion with 2031 projections showing USD 7.79 billion, growing at 7.72% CAGR over 2026-2031.
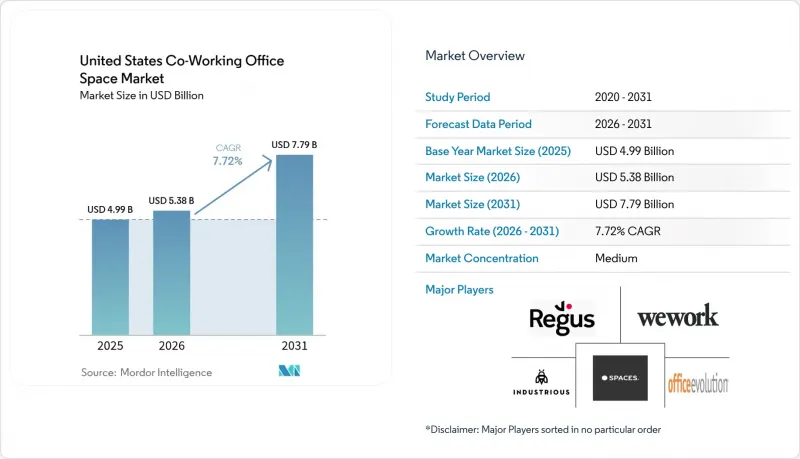
This report is Segmented by User (Freelancers, Enterprises, Start Ups and Others), Office Type (Grade A, Grade B, Grade C), Sector (IT and ITES, BFSI, Business Consulting & Professional Service, Other Services), and Region (Northeast, Midwest, Southeast, West, Southwest). The Market Forecasts are Provided in Terms of Value (USD).
United States Coworking Office Space Market Trends and Insights
Suburban Demand for Coworking Spaces
As commuting patterns evolve, a widening envelope of suburban submarkets is drawing both individuals and corporates. Regus projects that decentralised coworking could generate 1.635 million jobs and USD 197 billion in annual gross value add by 2029. Operators are re-purposing retail boxes, fitness centres and municipal libraries, enabling 15-minute-city lifestyles while achieving higher margin spreads than CBD locations given lower rents and fit-out costs.
Proliferation of Hybrid & Remote Work Models
Ninety-two percent of corporate real-estate leaders surveyed in 2024 confirmed that permanent hybrid attendance policies are already in force, with the three-days-in-office rhythm emerging as the dominant pattern. Companies consequently require only around two-thirds of their pre-pandemic desk count, yet must guarantee capacity during episodic surges for client meetings, trainings or sprints, making the US coworking workspace market an attractive elasticity valve. Financial-services employers-where 98% of staff want continued remote options-have become early movers, procuring on-demand suites to sustain collaboration without locking in 10- to 15-year leases. Cushman & Wakefield notes occupancy-cost savings topping 5% when coworking replaces overflow swing space, validating the economic case .
Economic Volatility Impacting Occupancy Levels
Commercial Edge recorded a 60% year-on-year drop in US office transaction volume in 2023 to USD 34 billion, reflecting broad investor caution. When sentiment weakens, corporates often unwind flex seats before down-sizing owned premises, creating rapid revenue pressure for operators. WeWork's post-bankruptcy restructuring underscores sensitivity to macro cycles, as variable-revenue models amplify downside risk during demand shocks. Higher interest rates further squeeze expansion plans by elevating fit-out financing costs, forcing many providers to delay new openings.
Other drivers and restraints analyzed in the detailed report include:
- Surge in Start-Up & Independent Workforce
- Corporate Drive to Cut Long-Term Lease Liabilities
- Profitability Challenges & Operator Consolidation
For complete list of drivers and restraints, kindly check the Table Of Contents.
Segment Analysis
Enterprises controlled 30.60% of 2025 revenue, cementing their influence over pricing and amenity standards in the US coworking workspace market. Many Fortune 1000 companies dedicate more than 10% of their footprints to coworking solutions, a share expected to climb to 58% within two years as hybrid programmes mature. The biggest corporates negotiate multi-city passes that allow staff to tap a nationwide footprint, ensuring location parity for project teams. Internal data-driven seat-management tools interface with operator APIs to release blocks of unused desks daily, boosting utilisation. This institutional behaviour provides recurring revenue that stabilises the overall US coworking workspace market against short-term start-up churn.
Start-ups and other emerging users represent the fastest-growing cohort with a 8.9% CAGR forecast to 2031, energising local communities in Austin, Miami and Raleigh. Lower entry barriers permit founders to iterate without a long-term rent burden, while remote-first digital agencies co-locate periodically for sprint cycles. Airlines, travel networks and even universities now bundle on-demand passes, broadening exposure and embedding the brand of the US coworking workspace market in unconventional channels.
Grade A space held 61.30% of US coworking workspace market share in 2025 as corporates prioritised best-in-class buildings with high ventilation, wellness accreditations and collaborative floor plates. Average Class A rents rose 3.1% despite elevated vacancy elsewhere, confirming a flight-to-quality trend. Operators in trophy towers differentiate through hospitality-level services and proprietary experience apps that aggregate booking, community events and ESG reporting. These premium centres anchor brand perception and allow providers to cascade design standards down portfolio tiers.
Grade B locations, while less central, are set to register an 10.64% CAGR through 2031, outperforming headline growth for the broader US coworking workspace market. Adaptive reuse of obsolete suburban offices and retail centres into coworking suites reduces capex relative to ground-up development. Tenants who value fit-out efficiency over prestige accept moderate design specifications in exchange for 20-30% rent discounts. Incremental upgrades-such as modular phone booths, smart-access control and LED retrofits-help operators capture rent premiums without undertaking full-scale deep retrofits.
Complete Report Scope:
- By User
- Freelancers
- Enterprises
- Start Ups and Others
- By Office Type
- Grade A
- Grade B
- Grade C
- By Sector
- Information Technology (IT and ITES)
- BFSI (Banking, Financial Services and Insurance)
- Business Consulting & Professional Service
- Other Services (Retail, Lifesciences, Energy, Legal Services)
- By Region
- Northeast
- Midwest
- Southeast
- West
- Southwest
List of Companies Covered in this Report:
- WeWork
- Regus (IWG)
- Spaces (IWG)
- Industrious Office
- Office Evolution
- Venture X
- Serendipity Labs
- Impact Hub
- Knotel
- Convene
- CommonGrounds Workspace
- HQ (HQ Global Workspaces)
- Premier Workspaces
- MakeOffices
- TechSpace
- Mindspace
- Workbar
- Alliance Virtual Offices
- Novel Coworking (Expansive)
- Daybase
Additional Benefits:
- The market estimate (ME) sheet in Excel format
- 3 months of analyst support
TABLE OF CONTENTS
1 Introduction
- 1.1 Study Assumptions & Market Definition
- 1.2 Scope of the Study
2 Research Methodology
3 Executive Summary
4 Market Landscape
- 4.1 Market Drivers
- 4.1.1 Proliferation of hybrid & remote work models
- 4.1.2 Surge in startup & freelancer population
- 4.1.3 Corporate drive to cut long-term lease liabilities
- 4.1.4 Suburban demand for flexible spaces
- 4.1.5 Landlord-operator revenue-sharing agreements
- 4.1.6 Data-driven occupancy analytics & dynamic pricing
- 4.2 Market Restraints
- 4.2.1 Economic volatility impacting occupancy levels
- 4.2.2 Profitability challenges & operator consolidation
- 4.2.3 Rising construction / retrofit costs for Class-A flex
- 4.2.4 Municipal zoning limits on adaptive conversions
- 4.3 Value / Supply-Chain Analysis
- 4.4 Regulatory Landscape
- 4.5 Technological Outlook
- 4.6 Porter's Five Forces
- 4.6.1 Threat of New Entrants
- 4.6.2 Bargaining Power of Suppliers
- 4.6.3 Bargaining Power of Buyers
- 4.6.4 Threat of Substitutes
- 4.6.5 Competitive Rivalry
- 4.7 Remote Working Impact
- 4.8 Rent & Leasing Analysis
5 Market Size & Growth Forecasts (Value)
- 5.1 By User
- 5.1.1 Freelancers
- 5.1.2 Enterprises
- 5.1.3 Start Ups and Others
- 5.2 By Office Type
- 5.2.1 Grade A
- 5.2.2 Grade B
- 5.2.3 Grade C
- 5.3 By Sector
- 5.3.1 Information Technology (IT and ITES)
- 5.3.2 BFSI (Banking, Financial Services and Insurance)
- 5.3.3 Business Consulting & Professional Service
- 5.3.4 Other Services (Retail, Lifesciences, Energy, Legal Services)
- 5.4 By Region
- 5.4.1 Northeast
- 5.4.2 Midwest
- 5.4.3 Southeast
- 5.4.4 West
- 5.4.5 Southwest
6 Competitive Landscape
- 6.1 Market Concentration
- 6.2 Strategic Moves
- 6.3 Market Share Analysis
- 6.4 Company Profiles (includes Global level Overview, Market level overview, Core Segments, Financials as available, Strategic Information, Market Rank/Share for key companies, Products & Services, and Recent Developments)
- 6.4.1 WeWork
- 6.4.2 Regus (IWG)
- 6.4.3 Spaces (IWG)
- 6.4.4 Industrious Office
- 6.4.5 Office Evolution
- 6.4.6 Venture X
- 6.4.7 Serendipity Labs
- 6.4.8 Impact Hub
- 6.4.9 Knotel
- 6.4.10 Convene
- 6.4.11 CommonGrounds Workspace
- 6.4.12 HQ (HQ Global Workspaces)
- 6.4.13 Premier Workspaces
- 6.4.14 MakeOffices
- 6.4.15 TechSpace
- 6.4.16 Mindspace
- 6.4.17 Workbar
- 6.4.18 Alliance Virtual Offices
- 6.4.19 Novel Coworking (Expansive)
- 6.4.20 Daybase
7 Market Opportunities & Future Outlook

