PUBLISHER: Mordor Intelligence | PRODUCT CODE: 2100688

PUBLISHER: Mordor Intelligence | PRODUCT CODE: 2100688
India E-commerce - Market Share Analysis, Industry Trends & Statistics, Growth Forecasts (2026 - 2031)
According to Mordor Intelligence, the India e-commerce market size stood at USD 159.25 billion in 2026 and is projected to reach USD 332.94 billion by 2031, reflecting a 15.89% CAGR over the forecast period.
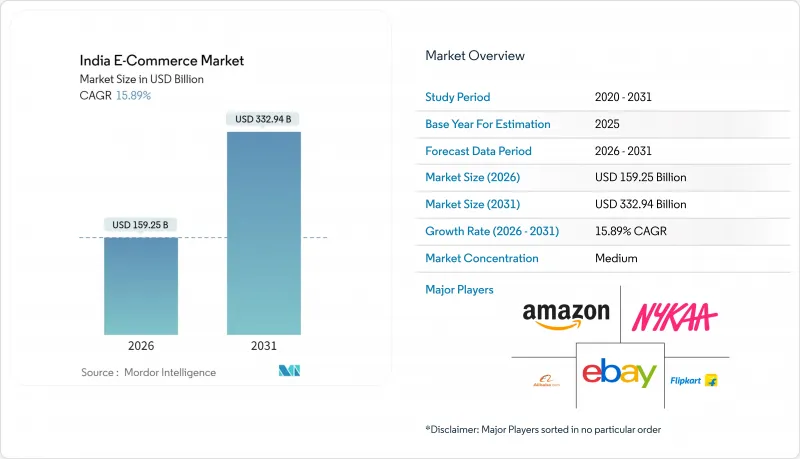
This report is Segmented by Business Model (B2C, and B2B), Device Type (Smartphone/Mobile, Desktop and Laptop, and More), Payment Method (Credit/Debit Cards, Digital Wallets and UPI, BNPL, and More), Product Category (Beauty and Personal Care, Consumer Electronics, Fashion and Apparel, Food and Beverages, Furniture and Home, and More), and Geography. The Market Forecasts are Provided in Terms of Value (USD).
India E-commerce Market Trends and Insights
Quick-Commerce Penetration in Top-20 Cities Drives Momentum
Quick-commerce platforms have opened more than 1,200 micro-fulfillment sites, enabling 10-minute grocery delivery within 2-3 kilometers of dense catchments. Order frequency has risen to 4-5 purchases per user each month, lifting customer lifetime value above USD 300 over 12 months. Average basket sizes of USD 8-10 remain lower than traditional e-commerce, yet high repeat rates keep churn below 15%. Operating viability depends on 25-30 orders per location per hour, a threshold reached by only 40% of active dark stores in 2025, signaling likely consolidation. Zoning ambiguity around residential dark stores adds execution risk, pushing some operators to relocate to industrial zones that extend delivery times by 10-15 minutes.
Rising UPI and Instant Payment Adoption in Tier II-III Cities
UPI processed 228 billion transactions in 2025, with Tier II-III cities generating 60% of incremental volume. The architecture's interoperability lets consumers toggle across marketplaces without re-entering credentials, shifting platform competition to assortment depth and fulfillment speed. Real-time settlement trims merchant working-capital cycles from a week to near-zero, freeing liquidity for inventory replenishment. Feature-phone users upgrading to sub-INR 7,000 (USD 84) smartphones gain embedded payment apps, lowering onboarding frictions. As cash-on-delivery declines, reverse-logistics risk and its 8-12% cost premium shrink, further boosting contribution margins in the India E-commerce Market.
Inconsistent Interstate Logistics and Reverse-Logistics Costs
Cross-border truck routes face documentation variance across 28 states and 8 union territories, adding 12-18 hours to transit. Reverse-logistics expenses consume 25-30% of order value on sub-USD 15 items, as pickups and quality checks lack forward-route density. Difficult topography in the North-East and Himalayan states necessitates USD 2-3 surcharges or exclusion from service maps, capping penetration at 85-90% of the national population. Non-standard packaging raises breakage claims to 8-10% for electronics, slicing margins by 3-5 percentage points. Only well-capitalized incumbents such as Flipkart and Amazon can absorb USD 500 million outlays for proprietary fleets, widening the moat over smaller rivals.
Other drivers and restraints analyzed in the detailed report include:
- Low-Cost Data Plans Fuel Video-Led Buying Journeys
- Government ONDC Framework Expands Seller Reach
- Compliance Burden from E-Commerce Rules Draft 2023
For complete list of drivers and restraints, kindly check the Table Of Contents.
Segment Analysis
The business-to-business slice of the India E-commerce Market size is expected to clock a 16.87% CAGR from 2026 to 2031, surpassing consumer momentum. IndiaMART reported significant growth in FY 2024, connecting millions of buyers with a vast network of suppliers across fragmented industrial categories. Faster invoice reconciliation and tax-compliant audit trails are shrinking working-capital cycles from 45-60 days to under 20 days. Government e-Marketplace processed USD 25 billion in procurement during FY 2024, validating institutional appetite for digital sourcing.
B2C transactions still dominate, holding 86.34% of India's e-commerce market share in 2025 on the back of electronics, fashion, and grocery demand. Dense last-mile networks enable 1-2 day deliveries in metros, a standard industrial supplier is beginning to emulate by co-locating spares inside consumer warehouses after peak retail hours. Hybrid fulfillment centers raise asset utilization above 80% and could narrow the growth-rate differential as Amazon India and Flipkart pilot shared nodes.
Smartphones generated 76.42% of the market share in 2025, underscoring India's mobile-first adoption pattern. The India E-commerce Market size attributed to smart TVs, voice assistants, and wearables is forecast to expand at an 18.23% CAGR through 2031, powered by ambient interfaces that enable hands-free reorders. Amazon's Alexa added voice shopping in 2024, generating 5-7% of repeat orders for low-consideration categories.
Desktop's share has stabilized near 20%, catering to high-ticket electronics and furniture where larger screens aid specification checks. Progressive web apps now deliver 80-85% of native-app conversion without app-store drop-off, easing reach to low-storage devices and trimming acquisition outlays by 20-30%.
Complete Report Scope:
- By Business Model
- B2C
- B2B
- By Device Type (B2C)
- Smartphone / Mobile
- Desktop and Laptop
- Other Device Types
- By Payment Method (B2C)
- Credit and Debit Cards
- Digital Wallets and UPI
- BNPL
- Other Payment Methods
- By Product Category (B2C)
- Beauty and Personal Care
- Consumer Electronics
- Fashion and Apparel
- Food and Beverages
- Furniture and Home
- Toys, DIY and Media
- Other Product Categories
List of Companies Covered in this Report:
- Amazon.com Inc.
- Flipkart Internet Pvt. Ltd.
- Reliance Retail Ltd.
- Meesho
- Nykaa E-Retail Pvt. Ltd.
- Tata CLiQ
- Myntra Designs Pvt. Ltd.
- BigBasket Inc.
- Blinkit Inc.
- Paytm Mall
- Pepperfry Pvt. Ltd.
- Lenskart Solutions Pvt. Ltd.
- FirstCry (BrainBees Solutions)
- IndiaMART InterMESH Ltd.
- Snapdeal Pvt. Ltd.
- Purplle.com
- Zivame (Actoserba Active Wholesale)
- ShopClues (Clues Network)
- eBay Inc.
- Alibaba Group (AliExpress)
- Apple Inc.
Additional Benefits:
- The market estimate (ME) sheet in Excel format
- 3 months of analyst support
TABLE OF CONTENTS
1 INTRODUCTION
- 1.1 Study Assumptions and Market Definition
- 1.2 Scope of the Study
2 RESEARCH METHODOLOGY
3 EXECUTIVE SUMMARY
4 MARKET LANDSCAPE
- 4.1 Market Overview
- 4.2 Market Drivers
- 4.2.1 Rising UPI and Instant Payment Adoption in Tier II-III Cities
- 4.2.2 Low-Cost Data Plans Driving Video-Led Buying Journeys
- 4.2.3 Direct-to-Consumer Brand Boom Fuelled by Domestic VC Funding
- 4.2.4 Quick-Commerce Penetration in Top-20 Cities Drives the Market
- 4.2.5 Social-Commerce Influencer Ecosystem Monetisation
- 4.2.6 Government ONDC Framework Expands Seller Reach (Under-the-Radar)
- 4.3 Market Restraints
- 4.3.1 Inconsistent Interstate Logistics and Reverse-Logistics Costs
- 4.3.2 Compliance Burden from E-Commerce Rules Draft 2023
- 4.3.3 High Customer Acquisition Cost Outside Metros
- 4.3.4 Data-Privacy Concerns Limiting Hyper-Personalisation
- 4.3.5 Rising Digital Ad Fraud Inflating Marketing Budgets (Under-the-Radar)
- 4.4 Industry Value Chain Analysis
- 4.5 Regulatory and Government Policy Outlook
- 4.6 Technological Outlook (AI, AR-Try-On, etc.)
- 4.7 Impact of Macroeconomic Factors on the Market
- 4.8 Porter's Five Forces Analysis
- 4.8.1 Bargaining Power of Suppliers
- 4.8.2 Bargaining Power of Buyers
- 4.8.3 Threat of New Entrants
- 4.8.4 Threat of Substitutes
- 4.8.5 Intensity of Competitive Rivalry
- 4.9 Key Market Trends and Share of E-Commerce in Total Retail
- 4.10 Analysis of Key Demographic Trends and Patterns
- 4.11 Analysis of Key Modes of Transaction
- 4.12 Cross-Border E-Commerce Outlook
- 4.13 Current Positioning of India within Asia-Pacific E-Commerce
5 MARKET SIZE AND GROWTH FORECASTS (VALUE)
- 5.1 By Business Model
- 5.1.1 B2C
- 5.1.2 B2B
- 5.2 By Device Type (B2C)
- 5.2.1 Smartphone / Mobile
- 5.2.2 Desktop and Laptop
- 5.2.3 Other Device Types
- 5.3 By Payment Method (B2C)
- 5.3.1 Credit and Debit Cards
- 5.3.2 Digital Wallets and UPI
- 5.3.3 BNPL
- 5.3.4 Other Payment Methods
- 5.4 By Product Category (B2C)
- 5.4.1 Beauty and Personal Care
- 5.4.2 Consumer Electronics
- 5.4.3 Fashion and Apparel
- 5.4.4 Food and Beverages
- 5.4.5 Furniture and Home
- 5.4.6 Toys, DIY and Media
- 5.4.7 Other Product Categories
6 COMPETITIVE LANDSCAPE
- 6.1 Market Concentration
- 6.2 Strategic Moves (M&A, Partnerships, Funding)
- 6.3 Market Share Analysis
- 6.4 Company Profiles (includes Global Level Overview, Market Level Overview, Core Segments, Financials as available, Strategic Information, Market Rank/Share, Products and Services, Recent Developments)
- 6.4.1 Amazon.com Inc.
- 6.4.2 Flipkart Internet Pvt. Ltd.
- 6.4.3 Reliance Retail Ltd.
- 6.4.4 Meesho
- 6.4.5 Nykaa E-Retail Pvt. Ltd.
- 6.4.6 Tata CLiQ
- 6.4.7 Myntra Designs Pvt. Ltd.
- 6.4.8 BigBasket Inc.
- 6.4.9 Blinkit Inc.
- 6.4.10 Paytm Mall
- 6.4.11 Pepperfry Pvt. Ltd.
- 6.4.12 Lenskart Solutions Pvt. Ltd.
- 6.4.13 FirstCry (BrainBees Solutions)
- 6.4.14 IndiaMART InterMESH Ltd.
- 6.4.15 Snapdeal Pvt. Ltd.
- 6.4.16 Purplle.com
- 6.4.17 Zivame (Actoserba Active Wholesale)
- 6.4.18 ShopClues (Clues Network)
- 6.4.19 eBay Inc.
- 6.4.20 Alibaba Group (AliExpress)
- 6.4.21 Apple Inc.
7 MARKET OPPORTUNITIES AND FUTURE OUTLOOK
- 7.1 White-Space and Unmet-Need Assessment

