PUBLISHER: Mordor Intelligence | PRODUCT CODE: 2125445

PUBLISHER: Mordor Intelligence | PRODUCT CODE: 2125445
Asia Pacific B2B E-commerce - Market Share Analysis, Industry Trends & Statistics, Growth Forecasts (2026 - 2031)
According to Mordor Intelligence, Asia-Pacific B2B e-commerce market size in 2026 is estimated at USD 10.32 billion, growing from 2025 value of USD 8.43 billion with 2031 projections showing USD 28.41 billion, growing at 22.45% CAGR over 2026-2031.
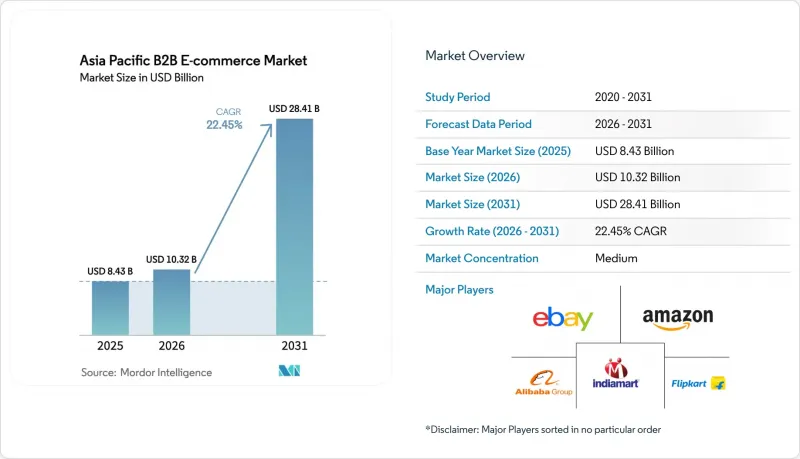
This report is Segmented by Channel (Direct Sales, and Marketplace Sales), Transaction Model (Domestic, and Cross-Border), Payment Method (Bank Transfers and ACH, Credit and Debit Cards, and More), Industry Vertical (Manufacturing, Retail and Wholesale, Healthcare and Life Sciences, Construction and Building Materials, and More), and Country. The Market Forecasts are Provided in Terms of Value (USD).
Asia Pacific B2B E-commerce Market Trends and Insights
Digital procurement adoption among APAC manufacturing SMEs
Manufacturing SMEs are abandoning manual requisition and phone-based ordering workflows as raw-material price volatility averaged 15-20% during 2024, forcing tighter spend controls. Vendors such as ProcMart lifted revenue from INR 2.2 billion (USD 0.026 billion) to INR 6.2 billion (USD 0.072 billion) in FY 2024 by delivering catalog search, spend analytics, and dynamic contract updates that trim purchase-order cycle times by up to 60%. While Tier-1 industrial corridors digitize at speed, penetration lags in Tier-2/3 districts where relationship-based buying remains entrenched.
Government-led e-invoicing mandates drive market acceleration
Singapore's nationwide PEPPOL network processed 1.2 million invoices from 50,000 firms by 2024, turning compliance into a catalyst for platform onboarding. India's GST e-invoicing clauses create a similar domino effect, pushing even micro-enterprises onto digital rails to remain eligible suppliers. Interoperable frameworks under the coming ASEAN. Digital Economy Framework Agreement aim at USD 1 trillion digital-economy value by 2030, with e-invoicing interoperability as a pillar. Network externalities will intensify as large buyers refuse non-compliant paper invoices.
Fragmented ASEAN tax and import compliance creates operational friction
Each ASEAN jurisdiction runs independent VAT rules, e-services levies, and invoice-clearance models. Marketplaces must embed jurisdiction-specific logic, inflating overheads and delaying vendor onboarding. Indonesia insists on real-time tax clearance for every invoice, whereas Singapore's PEPPOL flow stays voluntary, forcing platforms to juggle two integration tracks. These disparities blunt the scale economies that typically accelerate network-effect growth.
Other drivers and restraints analyzed in the detailed report include:
- 5G infrastructure enables real-time marketplace dynamics
- Embedded finance APIs democratize B2B credit access
- Digital-payment trust deficits constrain Tier-2/3 market penetration
For complete list of drivers and restraints, kindly check the Table Of Contents.
Segment Analysis
Marketplace sales controlled 77.45% of the Asia-Pacific B2B e-commerce market in 2025, a legacy of buyer dependence on aggregated supplier directories. Direct-sales portals, however, are accelerating at 24.8% CAGR as procurement leaders pursue deeper integration with ERP and logistics systems. Large manufacturers launch private portals that permit granular price negotiations, minimizing marketplace fees and data leakage.
The shift also reflects embedded-finance adoption within supplier-managed storefronts, enabling flexible settlement terms identical to marketplace offerings without ceding margin. While discovery remains easier on horizontal marketplaces, strategic items with recurring volumes increasingly migrate to direct rails for tighter quality control. Over the forecast horizon, marketplaces will likely pivot toward value-added financing and fulfillment services to defend relevance.
Domestic orders still account for 69.20% of the Asia-Pacific B2B e-commerce market size in 2025, but cross-border flows will rise faster at 26.1% CAGR, encouraged by tariff concessions under the Regional Comprehensive Economic Partnership. Paperless trade protocols now shave 3.8% off administrative costs per shipment and cut border-clearance time by 6.7%.
Currency-hedging tools and automated duty calculators embedded within platforms lower the operational barrier for SMEs to sell regionally. Nevertheless, multidimensional compliance across VAT, import licensing, and data-localization laws remains burdensome, particularly for micro-exporters lacking legal resources. Thus, service providers offering bundled customs brokerage and tax-filing APIs stand to capture incremental revenue.
Complete Report Scope:
- By Channel
- Direct Sales
- Marketplace Sales
- By Transaction Model
- Domestic
- Cross-border
- By Payment Method
- Bank Transfers and ACH
- Credit and Debit Cards
- Other Payment Methods
- By Industry Vertical
- Manufacturing
- Retail and Wholesale
- Healthcare and Life Sciences
- Automotive
- Construction and Building Materials
- Other Industry Verticals
- By Country
- China
- Japan
- India
- South Korea
- Australia and New Zealand
- Rest of Asia-Pacific
List of Companies Covered in this Report:
- Alibaba Group Holding Ltd.
- JD.com Inc.
- Amazon.com Inc.
- Flipkart Online Services Pvt Ltd.
- Coupang Corp.
- eBay Inc.
- IndiaMART InterMESH Ltd.
- Rakuten Group Inc.
- Global Sources Ltd.
- EC21 Inc.
- Made-in-China.com (Focus Technology)
- KOMPASS International SA
- Thomasnet (Thomas Publishing)
- Tradewheel Inc.
- IndiaMART subsidiary Tolexo Online
- Zetwerk
- BuyJunction (SAP Ariba India)
- L&T SuFin
Additional Benefits:
- The market estimate (ME) sheet in Excel format
- 3 months of analyst support
TABLE OF CONTENTS
1 INTRODUCTION
- 1.1 Study Assumptions and Market Definition
- 1.2 Scope of the Study
2 RESEARCH METHODOLOGY
3 EXECUTIVE SUMMARY
4 MARKET LANDSCAPE
- 4.1 Market Overview
- 4.2 Market Drivers
- 4.2.1 Digital procurement adoption among APAC manufacturing SMEs
- 4.2.2 Government-led e-invoicing mandates (e.g., PEPPOL, GST) drives the market
- 4.2.3 5G & fiber roll-out enabling real-time marketplaces drives the market
- 4.2.4 Embedded finance APIs de-risking B2B credit
- 4.2.5 Sustainability-driven paperless procurement targets
- 4.3 Market Restraints
- 4.3.1 Fragmented ASEAN tax and import compliance
- 4.3.2 Low digital-payment trust in Tier-2/3 markets
- 4.3.3 High logistics cost for bulky MRO goods
- 4.3.4 Vendor lock-in concerns among Japanese conglomerates
- 4.4 Industry Ecosystem Analysis
- 4.5 Regulatory Outlook
- 4.6 Porter's Five Forces Analysis
- 4.6.1 Bargaining Power of Suppliers
- 4.6.2 Bargaining Power of Buyers
- 4.6.3 Threat of New Entrants
- 4.6.4 Intensity of Competitive Rivalry
- 4.6.5 Threat of Substitutes
- 4.7 Assessment of Macro Economic Trends on the Market
- 4.8 Customer-Acquisition Trend Analysis
- 4.9 Major Case-Study Analysis
- 4.10 B2B Share of Total E-Commerce (China, Japan, South Korea)
- 4.11 Investment Analysis
5 MARKET SIZE AND GROWTH FORECASTS (VALUES)
- 5.1 By Channel
- 5.1.1 Direct Sales
- 5.1.2 Marketplace Sales
- 5.2 By Transaction Model
- 5.2.1 Domestic
- 5.2.2 Cross-border
- 5.3 By Payment Method
- 5.3.1 Bank Transfers and ACH
- 5.3.2 Credit and Debit Cards
- 5.3.3 Other Payment Methods
- 5.4 By Industry Vertical
- 5.4.1 Manufacturing
- 5.4.2 Retail and Wholesale
- 5.4.3 Healthcare and Life Sciences
- 5.4.4 Automotive
- 5.4.5 Construction and Building Materials
- 5.4.6 Other Industry Verticals
- 5.5 By Country
- 5.5.1 China
- 5.5.2 Japan
- 5.5.3 India
- 5.5.4 South Korea
- 5.5.5 Australia and New Zealand
- 5.5.6 Rest of Asia-Pacific
6 COMPETITIVE LANDSCAPE
- 6.1 Market Concentration
- 6.2 Strategic Moves
- 6.3 Market Share Analysis
- 6.4 Company Profiles {(includes Global level Overview, Market level overview, Core Segments, Financials as available, Strategic Information, Market Rank/Share for key companies, Products & Services, and Recent Developments)}
- 6.4.1 Alibaba Group Holding Ltd.
- 6.4.2 JD.com Inc.
- 6.4.3 Amazon.com Inc.
- 6.4.4 Flipkart Online Services Pvt Ltd.
- 6.4.5 Coupang Corp.
- 6.4.6 eBay Inc.
- 6.4.7 IndiaMART InterMESH Ltd.
- 6.4.8 Rakuten Group Inc.
- 6.4.9 Global Sources Ltd.
- 6.4.10 EC21 Inc.
- 6.4.11 Made-in-China.com (Focus Technology)
- 6.4.12 KOMPASS International SA
- 6.4.13 Thomasnet (Thomas Publishing)
- 6.4.14 Tradewheel Inc.
- 6.4.15 IndiaMART subsidiary Tolexo Online
- 6.4.16 Zetwerk
- 6.4.17 BuyJunction (SAP Ariba India)
- 6.4.18 L&T SuFin
7 MARKET OPPORTUNITIES AND FUTURE OUTLOOK
- 7.1 White-Space and Unmet-Need Assessment

