PUBLISHER: Mordor Intelligence | PRODUCT CODE: 2113188

PUBLISHER: Mordor Intelligence | PRODUCT CODE: 2113188
Indonesia Oil And Gas Upstream - Market Share Analysis, Industry Trends & Statistics, Growth Forecasts (2026 - 2031)
According to Mordor Intelligence, the Indonesia oil and gas upstream market size is expected to grow from USD 10.15 billion in 2025 to USD 10.72 billion in 2026 and is forecast to reach USD 14.09 billion by 2031 at 5.63% CAGR over 2026-2031.
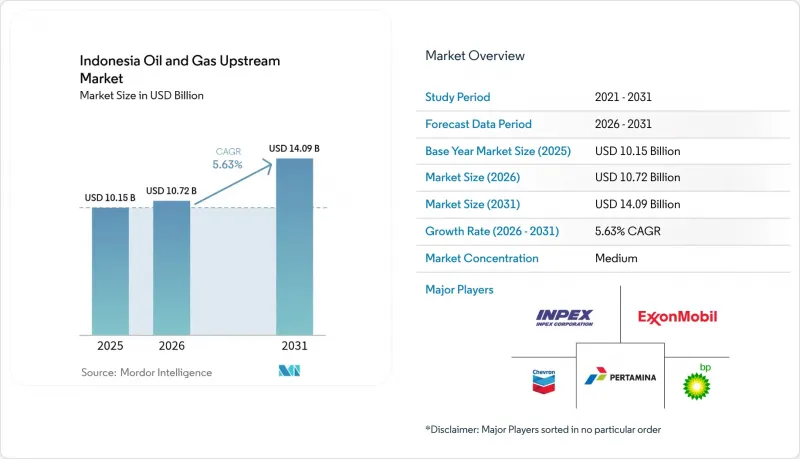
This report is Segmented by Location of Deployment (Onshore and Offshore), Resource Type (Crude Oil and Natural Gas), Well Type (Conventional and Unconventional), and Service (Exploration, Development and Production, and Decommissioning). The Market Sizes and Forecasts are Provided in Terms of Value (USD).
Indonesia Oil And Gas Upstream Market Trends and Insights
Fiscal & Licensing Reform Accelerates Investment Flows
Revisions to Government Regulation 35/2004 introduce a selectable gross-split regime that awards contractors up to a 95% revenue share for unconventional projects, thereby improving the net present value and shortening the payback period. Operators now switch between cost-recovery and gross-split frameworks to match project risk, an option that has already attracted joint studies from Eni, Harbour Energy, ExxonMobil, and BP. The regulatory update directly addresses earlier investor concerns about fiscal rigidity and stimulates license uptake in frontier acreage, particularly in deep-water tracts where risk-weighted economics favor higher contractor shares. Concurrently, streamlined permitting under MEMR Regulation 13/2024 reduces license approval time from 24 months to 12 months, enabling faster exploration cycles.
Deep-Water Gas Discoveries Reshape Resource Portfolio
The Layaran-1 find in South Andaman validated a 6 TCF resource base and 30 MMSCFD test flow, while the Timpan-1 well holds 5-6 TCF and 27 MMSCFD output potential. Alongside Eni's 5 TCF North Ganal discovery, Indonesia's proven reserves increased by roughly 30%, contingent upon appraisal. SKK Migas schedules the first gas between 2028 and 2030, necessitating subsea pipelines and floating LNG storage that anchor a new export corridor. INPEX's Abadi LNG, which completed FEED in 2024, targets 9.5 MTPA and USD 20 billion capex, reinforcing Indonesia's oil & gas upstream market leadership in regional LNG supply.
Aging Onshore Mature Fields Constrain Production Growth
Roughly 70% of Indonesia's 44,985 oil wells are mature, declining at a rate of 21% annually, and leaving 16,990 idle sites that require workovers or permanent abandonment (P&A) decisions. The heavy oil dominance in Central Sumatra's Duri and Rantau Bais fields, with API gravities below 25°, increases thermal and chemical EOR costs. Reactivation programs target 4,500 wells but face economic hurdles without further fiscal sweeteners. Consequently, sustaining base output diverts capital expenditures from exploration, moderating the growth curve of the Indonesian oil & gas upstream market.
Other drivers and restraints analyzed in the detailed report include:
- AI-Led Subsurface Imaging Transforms Operational Efficiency
- CCS-EOR Hubs Enable Tertiary Recovery Potential
- ESG-Driven Capital Scarcity Pressures Project Financing
For complete list of drivers and restraints, kindly check the Table Of Contents.
Segment Analysis
Offshore assets accounted for 56.20% of 2025 revenue and are expected to advance at a 5.88% CAGR, increasing the Indonesian oil & gas upstream market size for offshore assets to USD 8.01 billion by 2031. Massive gas clusters in Andaman and Masela underpin long-cycle cash flows, while brownfield subsea tie-backs around Mahakam preserve volume stability. Operators cite shorter sanction-to-first-gas timelines for jack-up re-entries, and flexible fiscal terms improve project IRR to double-digits under USD 65/bbl scenarios.
Onshore output trails, constrained by mature reservoirs but buffered by lower development costs and proximity to infrastructure. AI-aided workovers at Rokan achieved 152,161 bpd in June 2025, demonstrating that digital optimization can help narrow productivity gaps. Still, heavy crude viscosity and water-cut issues inflate lifting cost to USD 22/bbl versus offshore's USD 16/bbl. The government's aim to revive 4,500 idle wells should slow the decline; yet, offshore remains the main growth engine for the Indonesian oil & gas upstream market.
Crude oil held a 52.35% share in 2025, translating to USD 5.31 billion of the Indonesian oil & gas upstream market size, but expands modestly at a 3.95% CAGR as mature fields dominate the slate. Gas, in contrast, is expected to reach a 46.40% share by 2031, driven by a 6.05% CAGR, backed by startup schedules from Layaran, Timpan, and Abadi. Price-indexed LNG contracts enhance project netbacks when Asian spot prices trend above USD 16/MMBtu, attracting capital expenditure even amid debates about the energy transition.
Elevated CO2 in Natuna D-Alpha kept bids away, underscoring the need for CCS to unlock mega-gas. Meanwhile, domestic gasification programs accelerate demand from fertilizers and power plants, ensuring offtake security. Collectively, the growth of natural gas materially reshapes the revenue mix within the Indonesian oil & gas upstream market.
Complete Report Scope:
- By Location of Deployment
- Onshore
- Offshore
- By Resource Type
- Crude Oil
- Natural Gas
- By Well Type
- Conventional
- Unconventional
- By Service
- Exploration
- Development and Production
- Decomissioning
List of Companies Covered in this Report:
- PT Pertamina (Persero)
- Chevron Corp.
- ExxonMobil Corp.
- BP plc
- TotalEnergies SE
- INPEX Corp.
- Eni SpA
- CNOOC Ltd.
- Petroliam Nasional Berhad (Petronas)
- Medco Energi Internasional Tbk
- Energi Mega Persada Tbk
- Harbour Energy (Premier Oil)
- ConocoPhillips Indonesia Inc.
- Mubadala Energy
- Santos Ltd.
- Repsol SA
- Saka Energi Indonesia
- Black Platinum Energy Ltd.
- Indrillco Group
- KUFPEC Indonesia
Additional Benefits:
- The market estimate (ME) sheet in Excel format
- 3 months of analyst support
TABLE OF CONTENTS
1 Introduction
- 1.1 Study Assumptions & Market Definition
- 1.2 Scope of the Study
2 Research Methodology
3 Executive Summary
4 Market Landscape
- 4.1 Market Overview
- 4.2 Market Drivers
- 4.2.1 Fiscal & licensing reform (GR 35/2004 revisions)
- 4.2.2 Deep-water gas discoveries (Abadi, Andaman)
- 4.2.3 LNG export price-linkage upside
- 4.2.4 Production-sharing contract (PSC) extensions
- 4.2.5 CCS-EOR hubs enabling tertiary recovery
- 4.2.6 AI-led subsurface imaging accuracy
- 4.3 Market Restraints
- 4.3.1 Aging onshore mature fields
- 4.3.2 Regulatory & contract uncertainty
- 4.3.3 Deep-water talent gap
- 4.3.4 ESG-driven capital scarcity
- 4.4 Supply-Chain Analysis
- 4.5 Technological Outlook
- 4.6 Regulatory Landscape
- 4.7 Crude-Oil Production & Consumption Outlook
- 4.8 Natural-Gas Production & Consumption Outlook
- 4.9 Unconventional Resources CAPEX Outlook (tight oil, oil sands, deep-water)
- 4.10 Porter's Five Forces
- 4.10.1 Threat of New Entrants
- 4.10.2 Bargaining Power of Suppliers
- 4.10.3 Bargaining Power of Buyers
- 4.10.4 Threat of Substitutes
- 4.10.5 Competitive Rivalry
- 4.11 PESTLE Analysis
5 Market Size & Growth Forecasts
- 5.1 By Location of Deployment
- 5.1.1 Onshore
- 5.1.2 Offshore
- 5.2 By Resource Type
- 5.2.1 Crude Oil
- 5.2.2 Natural Gas
- 5.3 By Well Type
- 5.3.1 Conventional
- 5.3.2 Unconventional
- 5.4 By Service
- 5.4.1 Exploration
- 5.4.2 Development and Production
- 5.4.3 Decomissioning
6 Competitive Landscape
- 6.1 Market Concentration
- 6.2 Strategic Moves (M&A, Partnerships, PPAs)
- 6.3 Market Share Analysis (Market Rank/Share for key companies)
- 6.4 Company Profiles (includes Global level Overview, Market level overview, Core Segments, Financials as available, Strategic Information, Products & Services, and Recent Developments)
- 6.4.1 PT Pertamina (Persero)
- 6.4.2 Chevron Corp.
- 6.4.3 ExxonMobil Corp.
- 6.4.4 BP plc
- 6.4.5 TotalEnergies SE
- 6.4.6 INPEX Corp.
- 6.4.7 Eni SpA
- 6.4.8 CNOOC Ltd.
- 6.4.9 Petroliam Nasional Berhad (Petronas)
- 6.4.10 Medco Energi Internasional Tbk
- 6.4.11 Energi Mega Persada Tbk
- 6.4.12 Harbour Energy (Premier Oil)
- 6.4.13 ConocoPhillips Indonesia Inc.
- 6.4.14 Mubadala Energy
- 6.4.15 Santos Ltd.
- 6.4.16 Repsol SA
- 6.4.17 Saka Energi Indonesia
- 6.4.18 Black Platinum Energy Ltd.
- 6.4.19 Indrillco Group
- 6.4.20 KUFPEC Indonesia
7 Market Opportunities & Future Outlook
- 7.1 White-space & Unmet-Need Assessment

