PUBLISHER: Mordor Intelligence | PRODUCT CODE: 2113926

PUBLISHER: Mordor Intelligence | PRODUCT CODE: 2113926
Oil And Gas CAPEX - Market Share Analysis, Industry Trends & Statistics, Growth Forecasts (2026 - 2031)
According to Mordor Intelligence, the oil and gas cAPEX market size is estimated at USD 680.85 billion in 2026, and is expected to reach USD 830.62 billion by 2031, at a CAGR of 4.06% during the forecast period (2026-2031).
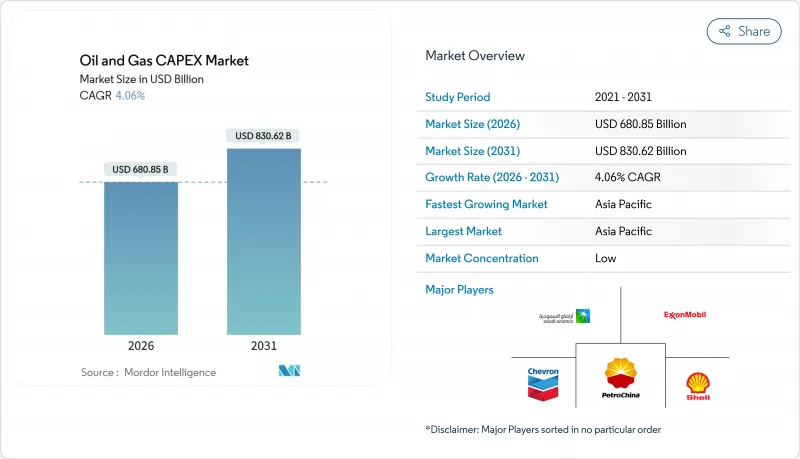
This report is Segmented by Sector (Upstream, Midstream, and Downstream), Location (Onshore and Offshore), Service (Construction, Maintenance and Turn-Around, and Decommissioning), and Geography (North America, Europe, Asia-Pacific, South America, and Middle East and Africa). The Market Sizes and Forecasts are Provided in Terms of Value (USD).
Global Oil And Gas CAPEX Market Trends and Insights
Increasing LNG-Ready Gas Infrastructure Build-Out
IEA tracks 290 billion cubic meters per year of new liquefaction capacity slated for 2025-2030, underpinning a wave of midstream investment. ExxonMobil recommitted USD 30 billion to restart Mozambique LNG in 2026, while Woodside approved a USD 17.5 billion Louisiana export facility expected online in 2029. Asian buyers continue to sign 15-20-year offtake agreements, de-risking project finance and enabling debt-to-equity ratios above 70:30. Lake Charles LNG reached mechanical completion in late 2025, adding 16.5 million tonnes per annum (mtpa) of nameplate capacity. Similar milestones at Plaquemines LNG tighten global supply-demand balances and sustain construction backlogs through decade-end.
Rising Deep-Water Discoveries Driving FIDs
Projects in water depths beyond 1,500 meters received FIDs covering 15 billion barrels of recoverable reserves during 2024-2025. Petrobras sanctioned Buzios 11 and Atapu 3 FPSOs, each rated for 180,000 barrels per day, leveraging standardized hulls that cut fabrication time by 18 months. Shell advanced Sparta in the US Gulf of Mexico at a USD 35 per barrel breakeven, and BP approved Kaskida using subsea boosting to extend plateau production by five years. TotalEnergies' Kaminho project in Angola integrates subsea-to-shore power, eliminating platform-generator emissions. Guyana's Whiptail and Hammerhead FPSOs will lift national capacity beyond 1.2 million barrels per day by 2027.
Volatility in Dated Brent Discouraging Long-Cycle Projects
Brent traded between USD 70 and USD 95 per barrel across 2024-2025, below breakevens for many frontier deepwater prospects, leading operators to defer 8-10 billion barrels of potential resources. Drilling costs above USD 150 million per well and 6-8-year timelines deter FIDs when forward curves flatten. Independent E&P companies saw borrowing costs rise by up to 200 basis points, pushing hurdle rates to 15-18% IRR. Capital is shifting to short-cycle shale and brownfield upgrades, potentially constraining global supply in the early 2030s if sanctioning does not rebound.
Other drivers and restraints analyzed in the detailed report include:
- NOC Upstream Spending Rebound in Middle East & Asia
- Surge in Maintenance CAPEX to Decarbonize Brownfields
- ESG-Linked Debt Covenants Capping Fossil CAPEX Ceilings
For complete list of drivers and restraints, kindly check the Table Of Contents.
Segment Analysis
Upstream captured a 73.24% share in 2025, and the CAPEX oil & gas market size for this segment is forecast to grow at a 4.12% CAGR through 2031. Deepwater FIDs totaling 15 billion barrels in 2024 across Brazil, the US Gulf of Mexico, Angola, and Guyana capitalize on standardized FPSO and subsea systems that reduce per-barrel costs. National oil companies are sustaining high spend levels, with Saudi Aramco, PetroChina, and CNOOC together exceeding USD 130 billion in combined upstream budgets during 2024.
Digital-twin platforms deliver 30-40% reductions in cost overruns, freeing capital for parallel projects and shortening schedules by up to 18 months. Midstream investment remains steady as hydrogen-ready pipelines and carbon-capture hubs secure US Department of Energy support. Downstream complexes in Asia and the Middle East integrate refining and petrochemicals to improve margins by 15-20% in response to declining OECD gasoline demand.
Complete Report Scope:
- By Sector
- Upstream
- Midstream
- Downstream
- By Location
- Onshore
- Offshore
- By Asset Type
- Construction
- Maintenance and Turn-around
- Decommissioning
- By Geography
- North America
- United States
- Canada
- Mexico
- Europe
- Norway
- United Kingdom
- Russia
- Netherlands
- Germany
- Rest of Europe
- Asia Pacific
- China
- India
- Japan
- South Korea
- ASEAN Countries
- Australia
- Rest of Asia Pacific
- South America
- Brazil
- Argentina
- Colombia
- Rest of South America
- Middle East and Africa
- Saudi Arabia
- United Arab Emirates
- Qatar
- Nigeria
- South Africa
- Rest of Middle East and Africa
- North America
Geography Analysis
Asia-Pacific captured 29.36% of 2025 spending, and the CAPEX oil & gas market size in the region is forecast to grow at a 4.83% CAGR to 2031. PetroChina's USD 60 billion annual budget and CNOOC's USD 13-14 billion offshore program underpin tight-gas and condensate growth targets. India's ONGC invests USD 8.6 billion in Krishna-Godavari assets and plans 10 mtpa of new regasification capacity by 2030. Woodside's Scarborough and Browse LNG projects add 13 mtpa of capacity, while Papua New Guinea and Vietnam develop integrated gas-to-power schemes.
North America and Europe together accounted for roughly 35% of 2025 CAPEX but recorded slower growth as institutional capital pivots toward renewables. The United States maintains leadership through 12,000 Permian wells and 27.5 mtpa of new LNG capacity at Woodside, Louisiana, and Lake Charles. Canada's USD 12 billion oil-sands expansions prioritize 30-year SAGD projects. European majors trimmed oil and gas CAPEX 12% in 2025 to fund offshore wind and batteries, yet Equinor sanctioned Johan Castberg, showing selective approval for high-return Norwegian Barents projects.
The Middle East and Africa hold near-25% of global spending. Saudi Aramco's USD 50 billion program boosts unconventional and offshore capacity, while QatarEnergy's North Field expansion adds 48 mtpa of LNG by 2027. Angola's Kaminho and Brazil's Buzios 11 demonstrate deepwater momentum, complemented by Guyana's additional FPSOs raising capacity above 1.2 million barrels per day.
- Saudi Aramco
- Exxon Mobil Corporation
- Shell plc
- BP plc
- TotalEnergies SE
- Chevron Corporation
- PetroChina (CNPC)
- CNOOC Ltd
- Equinor ASA
- Petrobras
- ConocoPhillips
- ENI SpA
- Suncor Energy
- Occidental Petroleum
- Woodside Energy
- Lukoil PJSC
- ONGC
- Cairn Oil & Gas (Vedanta)
- QatarEnergy
- SLB (Schlumberger)
- Halliburton
Additional Benefits:
- The market estimate (ME) sheet in Excel format
- 3 months of analyst support
TABLE OF CONTENTS
1 Introduction
- 1.1 Study Assumptions & Market Definition
- 1.2 Scope of the Study
2 Research Methodology
3 Executive Summary
4 Market Landscape
- 4.1 Market Overview
- 4.2 Market Drivers
- 4.2.1 Increasing LNG-ready gas infrastructure build-out
- 4.2.2 Rising deep-water discoveries driving FIDs
- 4.2.3 NOC upstream spending rebound in Middle East & Asia
- 4.2.4 Surge in "maintenance CAPEX" to decarbonise brownfields
- 4.2.5 Digital twin roll-outs cutting project overruns
- 4.2.6 Sub-1 MW modular FLNG attracting small-field sanctioning
- 4.3 Market Restraints
- 4.3.1 Volatility in Dated Brent discouraging long-cycle projects
- 4.3.2 Policy pivots toward renewables in OECD
- 4.3.3 Scarcity-pricing of Tier-1 EPC labour elevating costs
- 4.3.4 ESG-linked debt covenants capping fossil CAPEX ceilings
- 4.4 Supply-Chain Analysis
- 4.5 Regulatory Landscape
- 4.6 Technological Outlook
- 4.7 Crude-Oil Production and Consumption Outlook
- 4.8 Natural-Gas Production and Consumption Outlook
- 4.9 Installed Pipeline Capacity Analysis
- 4.10 Unconventional Resources CAPEX Outlook (tight oil, oil sands, deep-water)
- 4.11 Porter's Five Forces
- 4.11.1 Bargaining Power of Suppliers
- 4.11.2 Bargaining Power of Buyers
- 4.11.3 Threat of New Entrants
- 4.11.4 Threat of Substitutes
- 4.11.5 Intensity of Rivalry
5 Market Size & Growth Forecasts
- 5.1 By Sector
- 5.1.1 Upstream
- 5.1.2 Midstream
- 5.1.3 Downstream
- 5.2 By Location
- 5.2.1 Onshore
- 5.2.2 Offshore
- 5.3 By Asset Type
- 5.3.1 Construction
- 5.3.2 Maintenance and Turn-around
- 5.3.3 Decommissioning
- 5.4 By Geography
- 5.4.1 North America
- 5.4.1.1 United States
- 5.4.1.2 Canada
- 5.4.1.3 Mexico
- 5.4.2 Europe
- 5.4.2.1 Norway
- 5.4.2.2 United Kingdom
- 5.4.2.3 Russia
- 5.4.2.4 Netherlands
- 5.4.2.5 Germany
- 5.4.2.6 Rest of Europe
- 5.4.3 Asia Pacific
- 5.4.3.1 China
- 5.4.3.2 India
- 5.4.3.3 Japan
- 5.4.3.4 South Korea
- 5.4.3.5 ASEAN Countries
- 5.4.3.6 Australia
- 5.4.3.7 Rest of Asia Pacific
- 5.4.4 South America
- 5.4.4.1 Brazil
- 5.4.4.2 Argentina
- 5.4.4.3 Colombia
- 5.4.4.4 Rest of South America
- 5.4.5 Middle East and Africa
- 5.4.5.1 Saudi Arabia
- 5.4.5.2 United Arab Emirates
- 5.4.5.3 Qatar
- 5.4.5.4 Nigeria
- 5.4.5.5 South Africa
- 5.4.5.6 Rest of Middle East and Africa
- 5.4.1 North America
6 Competitive Landscape
- 6.1 Market Concentration
- 6.2 Strategic Moves (M&A, Partnerships, PPAs)
- 6.3 Market Share Analysis (Market Rank/Share for key companies)
- 6.4 Company Profiles (includes Global level Overview, Market level overview, Core Segments, Financials as available, Strategic Information, Products & Services, and Recent Developments)
- 6.4.1 Saudi Aramco
- 6.4.2 Exxon Mobil Corporation
- 6.4.3 Shell plc
- 6.4.4 BP plc
- 6.4.5 TotalEnergies SE
- 6.4.6 Chevron Corporation
- 6.4.7 PetroChina (CNPC)
- 6.4.8 CNOOC Ltd
- 6.4.9 Equinor ASA
- 6.4.10 Petrobras
- 6.4.11 ConocoPhillips
- 6.4.12 ENI SpA
- 6.4.13 Suncor Energy
- 6.4.14 Occidental Petroleum
- 6.4.15 Woodside Energy
- 6.4.16 Lukoil PJSC
- 6.4.17 ONGC
- 6.4.18 Cairn Oil & Gas (Vedanta)
- 6.4.19 QatarEnergy
- 6.4.20 SLB (Schlumberger)
- 6.4.21 Halliburton
7 Market Opportunities & Future Outlook
- 7.1 White-space & Unmet-Need Assessment

