PUBLISHER: Mordor Intelligence | PRODUCT CODE: 2116344

PUBLISHER: Mordor Intelligence | PRODUCT CODE: 2116344
North America Office Real Estate - Market Share Analysis, Industry Trends & Statistics, Growth Forecasts (2026 - 2031)
According to Mordor Intelligence, the North America office real estate market size in 2026 is estimated at USD 427.49 billion, growing from 2025 value of USD 412.98 billion with 2031 projections showing USD 507.84 billion, growing at 3.51% CAGR over 2026-2031.
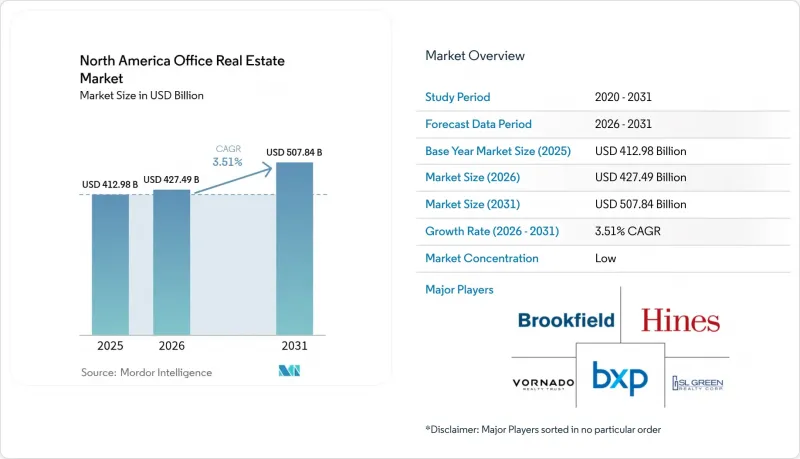
This report is Segmented by by Building Grade (Grade A, Grade B, and More), by Transaction Type (Rental and Sales), by End Use (Information Technology (IT & ITES), BFSI (Banking, Financial Services and Insurance), and More) and by Country (United States, Canada and Mexico). The Report Offers Market Size and Forecasts in Value (USD) for all the Above Segments.
North America Office Real Estate Market Trends and Insights
Return-to-office mandates lifting premium leasing
Large employers such as Amazon, Starbucks, and IBM reinstated four-to-five-day attendance rules in 2024, pushing 75% of U.S. white-collar staff under set office-presence targets. Tenants now concentrate on best-in-class towers where high-spec ventilation, wellness certifications, and vibrant amenities help justify commutes. The 100 biggest leases averaged 288,834 sq ft, up 8% year on year, with 68% structured as renewals to lock cost certainty. Financial-services occupiers dominated Manhattan's high-rent deals, securing 64% of leases above USD 100 psf and nearly tripling contracts above USD 200 psf. Employers with set attendance policies report lower turnover versus fully remote peers, reinforcing premium-space demand signals.
Capital surge for opportunistic office buys post-rate cuts
Easing monetary policy has revived deal pipelines for well-capitalized investors. Private-credit giants alone amassed more than USD 40 billion earmarked for bridge-to-core office debt, led by KKR's USD 42 billion pipeline. Assets in distress trade at 30-70% below replacement cost, especially in secondary U.S. metros where local banks pulled back lending. Monarch Capital Partners deployed USD 3.6 billion into opportunistic plays by April 2024, benefiting from a USD 929 billion commercial mortgage maturity wall through 2025. REITs added USD 84.7 billion of fresh equity in 2024 to hunt similar bargains.
Persistently hybrid work cutting net absorption
Hybrid work stabilized at 80% adoption even as mandates intensified, with actual U.S. office utilization averaging only 38% of capacity in 2024. Organizations reduced seat counts by 15% per head, targeting 25% smaller footprints via sharing ratios above 1.5:1. Vacancy climbed to 19% by Q1 2025, the highest since the early 1990s. Nearly half of surveyed employees would quit rather than return full-time, valuing flexibility at an 8% pay uplift. These shifts permanently depress absorption of generic space, tilting demand toward fewer, higher-quality locations.
Other drivers and restraints analyzed in the detailed report include:
- Flight-to-quality toward green amenity-rich buildings
- AI-driven upgrades converting Grade B/C offices to edge data centers
- Refinancing wall amid tighter bank lending
For complete list of drivers and restraints, kindly check the Table Of Contents.
Segment Analysis
Grade A space captured 47.10% of the North America office real estate market share in 2025 and continues to lead absorption trends as tenants consolidate into modern, tech-enabled environments. Prime towers posted positive leasing of 49 million sq ft versus a 170 million sq ft loss in non-prime categories. Average asking rents in Grade A exceed lower classes by 84%, reflecting superior amenities and ESG credentials. Financial services firms signed 64% of USD 100-plus rents in Manhattan, further tightening supply at the top end.
Competitive gaps will widen through the decade. The fastest-growing slice-ultra-prime, ESG-certified assets-should track a 3.85% CAGR, underpinned by carbon-penalty regimes such as Local Law 97 that elevate compliant stock values. Vacancy inside Toronto's AAA cluster, for instance, rests at 7.2% against citywide 18%. Investments in smart-building tech, wellness amenities, and on-site power resilience will cement pricing power for landlords in this tier, while older buildings head toward conversion or repricing.
Complete Report Scope:
- By Building Grade
- Grade A
- Grade B
- Grade C
- By Transaction Type
- Rental
- Sales
- By End Use
- Information Technology (IT & ITES)
- BFSI (Banking, Financial Services and Insurance)
- Business Consulting & Professional Services
- Other Services (Retail, Lifescience, Energy, Legal)
- By Country
- United States
- Canada
- Mexico
List of Companies Covered in this Report:
- Hines
- Brookfield Asset Management
- BXP Inc.
- SL Green Realty Corp.
- Vornado Realty Trust
- JBG SMITH Properties
- Trammell Crow Company
- Turner Construction Company
- CBRE Group Inc.
- Jones Lang LaSalle (JLL)
- Cushman & Wakefield
- Colliers International
- Newmark Group Inc.
- Avison Young
- Skanska USA
- Clark Construction Group
- DPR Construction
- Gilbane Building Company
- PCL Constructors Inc.
- HITT Contracting Inc.
- Hensel Phelps
- SHANNON WALTCHACK LLC
Additional Benefits:
- The market estimate (ME) sheet in Excel format
- 3 months of analyst support
TABLE OF CONTENTS
1 Introduction
- 1.1 Study Assumptions & Market Definition
- 1.2 Scope of the Study
2 Research Methodology
3 Executive Summary
4 Market Insights and Dynamics
- 4.1 Market Overview
- 4.2 Market Drivers
- 4.2.1 Return-to-Office Policies Increasing Premium-Grade Leasing Demand
- 4.2.2 Record High Capital Availability for Opportunistic Office Investments Post-Rate Cuts
- 4.2.3 Flight-to-Quality Trend Favoring Energy-Efficient, Amenity-Rich Buildings
- 4.2.4 AI Model Training Loads Driving Conversion of Grade-B/C Stock to Edge Data Centers
- 4.2.5 Municipal "Green Overlay" Zoning Incentives Fast-Tracking Office-to-Residential Conversions
- 4.2.6 Rise of Private Credit Funds Offering Bridge-to-Core Financing for Distressed Assets
- 4.3 Market Restraints
- 4.3.1 Persistent Hybrid Work Adoption Reducing Net Absorption
- 4.3.2 Elevated Refinancing Wall & Tightened Bank Lending Standards
- 4.3.3 Generative-AI Workplace Planning Tools Optimizing Space Use, Cutting Footprints
- 4.3.4 Local Energy-Performance Mandates Penalizing Older Assets
- 4.4 Value / Supply-Chain Analysis
- 4.4.1 Overview
- 4.4.2 Real Estate Developers and Contractors - Key Quantitative and Qualitative Insights
- 4.4.3 Architectural and Engineering Companies - Key Quantitative and Qualitative Insights
- 4.4.4 Building Material and Equipment Companies - Key Quantitative and Qualitative Insights
- 4.5 Government Regulations and Initiatives in the Industry
- 4.6 Technological Innovations in the Office Real Estate Market
- 4.7 Insights into Rental Yields in the Office Real Estate Segment
- 4.8 Insights into the Key Office Real Estate Industry Metrics (Supply, Rentals, Prices, Occupancy/Vacancy (%))
- 4.9 Insights into Office Real Estate Construction Costs
- 4.10 Insights into Office Real Estate Investment
- 4.11 Impact of Remote Working on Space Demand
- 4.12 Porter's Five Forces
- 4.12.1 Threat of New Entrants
- 4.12.2 Bargaining Power of Buyers / Occupiers
- 4.12.3 Bargaining Power of Developers / Landlords
- 4.12.4 Threat of Substitutes (WFH, Flexible Space)
- 4.12.5 Competitive Rivalry
5 Market Size & Growth Forecasts (Value, USD billion)
- 5.1 By Building Grade
- 5.1.1 Grade A
- 5.1.2 Grade B
- 5.1.3 Grade C
- 5.2 By Transaction Type
- 5.2.1 Rental
- 5.2.2 Sales
- 5.3 By End Use
- 5.3.1 Information Technology (IT & ITES)
- 5.3.2 BFSI (Banking, Financial Services and Insurance)
- 5.3.3 Business Consulting & Professional Services
- 5.3.4 Other Services (Retail, Lifescience, Energy, Legal)
- 5.4 By Country
- 5.4.1 United States
- 5.4.2 Canada
- 5.4.3 Mexico
6 Competitive Landscape
- 6.1 Market Concentration
- 6.2 Strategic Moves
- 6.3 Company Profiles (includes Global level Overview, Market level overview, Core Segments, Financials as available, Strategic Information, Market Rank/Share for key companies, Products & Services, and Recent Developments)
- 6.3.1 Hines
- 6.3.2 Brookfield Asset Management
- 6.3.3 BXP Inc.
- 6.3.4 SL Green Realty Corp.
- 6.3.5 Vornado Realty Trust
- 6.3.6 JBG SMITH Properties
- 6.3.7 Trammell Crow Company
- 6.3.8 Turner Construction Company
- 6.3.9 CBRE Group Inc.
- 6.3.10 Jones Lang LaSalle (JLL)
- 6.3.11 Cushman & Wakefield
- 6.3.12 Colliers International
- 6.3.13 Newmark Group Inc.
- 6.3.14 Avison Young
- 6.3.15 Skanska USA
- 6.3.16 Clark Construction Group
- 6.3.17 DPR Construction
- 6.3.18 Gilbane Building Company
- 6.3.19 PCL Constructors Inc.
- 6.3.20 HITT Contracting Inc.
- 6.3.21 Hensel Phelps
- 6.3.22 SHANNON WALTCHACK LLC
7 Market Opportunities & Future Outlook

