PUBLISHER: Mordor Intelligence | PRODUCT CODE: 2116325

PUBLISHER: Mordor Intelligence | PRODUCT CODE: 2116325
Europe Office Real Estate - Market Share Analysis, Industry Trends & Statistics, Growth Forecasts (2026 - 2031)
According to Mordor Intelligence, the Europe office real estate market size is projected to be USD 378.74 billion in 2025, USD 392.48 billion in 2026, and reach USD 478.66 billion by 2031, growing at a CAGR of 4.05% from 2026 to 2031.
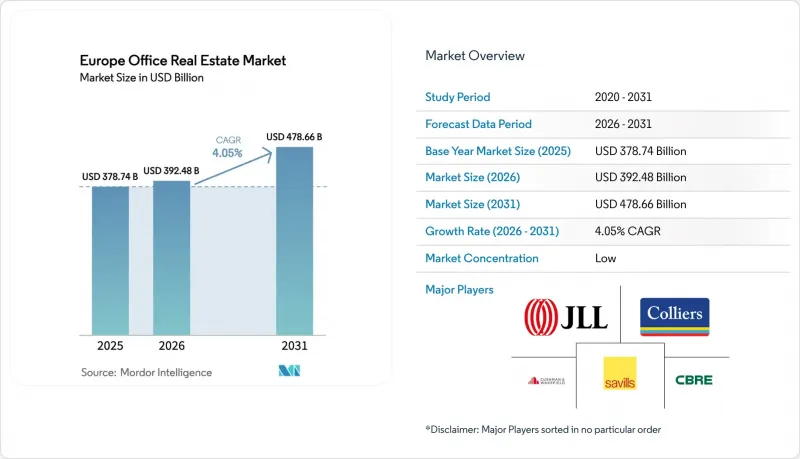
This report is Segmented by Building Grade (Grade A, Grade B, Grade C), by Transaction Type (Rental, Sales), by End User (IT & ITES, BFSI, Business Consulting & Professional Services, Other Services), and by Geography (Germany, UK, France, Italy, Spain, Rest of Europe). The Market Forecasts are Provided in Terms of Value (USD).
Europe Office Real Estate Market Trends and Insights
Nearshoring Expansion of US and Asian Tech Giants into Tier-1 European Cities Raising Large-Floorplate Absorption
Microsoft, Google, ByteDance, and Tencent expanded their hubs in Germany, Ireland, and the Netherlands during 2025, each signing contiguous blocks exceeding 5,000 m2 to co-locate engineering and cloud operations teams. Frankfurt's Q1 2025 take-up hit 194,600 m2, the strongest quarterly absorption since 2019, and lifted prime rents to USD 52 per m2 per month. High-spec, edge-compute-adjacent floorplates are leasing before completion, pulling forward revenue recognition for developers but capping upside if market rents accelerate faster than fixed escalators. Secondary cities lacking fiber connectivity or international airports have failed to capture comparable volumes, widening geographic divergence across the region.
EU EPBD 2026 Zero-Emission Mandate Accelerating Pre-Emptive Green Upgrades
The Energy Performance of Buildings Directive requires all new non-residential construction after 2026 to emit zero on-site fossil-fuel emissions and imposes phased retrofits for existing assets by 2030. Landlords in Germany and the Netherlands have front-loaded heat-pump, facade-insulation, and rooftop-solar programs, compressing cap rates on certified assets by as much as 75 basis points compared with non-compliant peers . Retrofit costs averaging USD 165-275 per m2 are squeezing small owners but rewarding early movers with 10%-plus rental premiums. Municipal enforcement is already separating a two-tier market in which EPC A stock enjoys valuation resilience while C-rated buildings confront stranded-asset risk. As a result, capital is flowing toward refurbishment pipelines rather than speculative ground-up towers, tightening Grade A supply in core districts.
Sustained High ECB Interest Rates and Tighter Credit Spreads Suppressing Development Pipelines
The European Central Bank kept its deposit rate at 2.75% in January 2025, pushing total borrowing costs for speculative office projects above 6%. Developers now require stabilized yields of 7%-8% to break even, a hurdle only fully pre-leased Grade A towers can clear. Frankfurt, Munich, and Amsterdam each saw permitting volumes fall 40%-50% versus 2022 peaks, severely restricting post-2027 deliveries. Refinancing risk for loans originated in 2020-21 is triggering opportunistic asset sales at double-digit discounts, yet bid-ask gaps remain wide, freezing many transactions.
Other drivers and restraints analyzed in the detailed report include:
- Corporate Science Based Targets Net-Zero Commitments Fueling Demand for Energy-Positive Flagship Offices
- EU Recovery & Resilience Facility Green-Retrofit Funds Unlocking CapEx for Aging Stock in CEE Markets
- Sublease Wave from Corporates Hitting <= 30% Utilization, Pressuring Prime Rents
For complete list of drivers and restraints, kindly check the Table Of Contents.
Segment Analysis
Grade A assets accounted for 55.68% of Europe office real estate market size in 2025 and are projected to grow at a 4.99% CAGR through 2031. Prime CBD rents for Grade A exceeded USD 57 per m2 per month in Munich during 2025, 30% above comparable Grade B space, underscoring tenants' readiness to pay premiums for wellness amenities, column-free floorplates and ESG credentials. The segment benefits from tight supply because financing for speculative projects is scarce, and embodied-carbon rules steer developers toward refurbishing older stock rather than building fresh towers. Grade B assets occupy roughly one-third of inventory and show a bifurcated outlook: centrally located offices within 500 m of transit nodes are attracting value-add investors who inject USD 110-165 per m2 of retrofit capital to meet EPC B thresholds, whereas car-dependent suburban properties face conversion or demolition. Grade C buildings, often built prior to 1990, are exiting the market entirely as conversion rates to residential or life-science uses doubled to 12% of stock in 2024.
Flight-to-quality dynamics are visible in leasing spreads: Frankfurt Grade A rents at USD 52 per m2 per month stand USD 17 higher than Grade B comparables and the differential has widened 600 bps since 2019. Occupiers cite employee-engagement goals and Scope 2 carbon targets as key drivers. The divergence is reinforcing investor appetite for refurb-to-core strategies, compressing yields on upgraded Grade B to within 100 bps of Grade A. With the EPBD deadline looming, lenders have begun to reserve preferential loan-to-value ratios for certified assets, tilting the balance further toward high-grade stock and accelerating the write-off of obsolete offices.
Complete Report Scope:
- By Building Grade
- Grade A
- Grade B
- Grade C
- By Transaction Type
- Rental
- Sales
- By End User
- Information Technology (IT & ITES)
- BFSI (Banking, Financial Services and Insurance)
- Business Consulting & Professional Services
- Other Services (Retail, Lifescience, Energy, Legal)
- By Country
- Germany
- UK
- France
- Italy
- Spain
- Rest of Europe
List of Companies Covered in this Report:
- Jones Lang LaSalle IP, Inc.
- CBRE
- Cushman & Wakefield
- Savills
- Colliers
- STRABAG SE
- HOCHTIEF
- AF Gruppen
- Aroundtown SA
- Gecina
- Skanska AB
- Bouygues Immobilier
- Hines
- Unibail-Rodamco-Westfield
- Vonovia SE
- SEGRO Plc
- Merlin Properties Socimi, S.A.
- Alstria Office AG
- BNP Paribas Real Estate
- PATRIZIA
Additional Benefits:
- The market estimate (ME) sheet in Excel format
- 3 months of analyst support
TABLE OF CONTENTS
1 Introduction
- 1.1 Study Assumptions & Market Definition
- 1.2 Scope of the Study
2 Research Methodology
3 Executive Summary
4 Market Insights and Dynamics
- 4.1 Market Overview
- 4.2 Market Drivers
- 4.2.1 Imminent EU EPBD (2026) zero-emission mandate accelerating pre-emptive green upgrades
- 4.2.2 Corporate Science Based Targets net-zero commitments fueling demand for energy-positive flagship offices
- 4.2.3 Nearshoring expansion of US and Asian tech giants into tier-1 European cities raising large-floorplate absorption
- 4.2.4 EU Recovery & Resilience Facility green-retrofit funds unlocking CapEx for aging stock in CEE markets
- 4.2.5 AI-data-center ecosystem spillover generating micro-cluster office demand near edge-compute power hubs
- 4.2.6 Emergence of tradable digital building passports enabling cheaper green financing for smart-metered assets
- 4.3 Market Restraints
- 4.3.1 Sustained high ECB interest rates and tighter credit spreads suppressing development pipelines
- 4.3.2 Sub-lease wave from corporates hitting ?30 % utilization, pressuring prime rents
- 4.3.3 15-minute-city zoning caps curbing future CBD office stock in progressive municipalities
- 4.3.4 Embodied-carbon caps limiting approvals for steel-and-glass tower redevelopments
- 4.4 Value / Supply-Chain Analysis
- 4.4.1 Overview
- 4.4.2 Real Estate Developers and Contractors - Key Quantitative and Qualitative Insights
- 4.4.3 Architectural and Engineering Companies - Key Quantitative and Qualitative Insights
- 4.4.4 Building Material and Equipment Companies - Key Quantitative and Qualitative Insights
- 4.5 Government Regulations and Initiatives in the Industry
- 4.6 Technological Innovations in the Office Real Estate Market
- 4.7 Insights into Rental Yields in the Office Real Estate Segment
- 4.8 Insights into the Key Office Real Estate Industry Metrics (Supply, Rentals, Prices, Occupancy/Vacancy (%))
- 4.9 Insights into Office Real Estate Construction Costs
- 4.10 Insights into Office Real Estate Investment
- 4.11 Impact of Remote Working on Space Demand
- 4.12 Industry Attractiveness - Porter's Five Forces
- 4.12.1 Threat of New Entrants
- 4.12.2 Bargaining Power of Buyers
- 4.12.3 Bargaining Power of Suppliers
- 4.12.4 Threat of Substitutes
- 4.12.5 Competitive Rivalry
5 Market Size & Growth Forecasts (Value, In USD Billion)
- 5.1 By Building Grade
- 5.1.1 Grade A
- 5.1.2 Grade B
- 5.1.3 Grade C
- 5.2 By Transaction Type
- 5.2.1 Rental
- 5.2.2 Sales
- 5.3 By End User
- 5.3.1 Information Technology (IT & ITES)
- 5.3.2 BFSI (Banking, Financial Services and Insurance)
- 5.3.3 Business Consulting & Professional Services
- 5.3.4 Other Services (Retail, Lifescience, Energy, Legal)
- 5.4 By Country
- 5.4.1 Germany
- 5.4.2 UK
- 5.4.3 France
- 5.4.4 Italy
- 5.4.5 Spain
- 5.4.6 Rest of Europe
6 Competitive Landscape
- 6.1 Market Concentration
- 6.2 Strategic Moves
- 6.3 Company Profiles (includes Global level Overview, Market level overview, Core Segments, Financials as available, Strategic Information, Products & Services, and Recent Developments)
- 6.3.1 Jones Lang LaSalle IP, Inc.
- 6.3.2 CBRE
- 6.3.3 Cushman & Wakefield
- 6.3.4 Savills
- 6.3.5 Colliers
- 6.3.6 STRABAG SE
- 6.3.7 HOCHTIEF
- 6.3.8 AF Gruppen
- 6.3.9 Aroundtown SA
- 6.3.10 Gecina
- 6.3.11 Skanska AB
- 6.3.12 Bouygues Immobilier
- 6.3.13 Hines
- 6.3.14 Unibail-Rodamco-Westfield
- 6.3.15 Vonovia SE
- 6.3.16 SEGRO Plc
- 6.3.17 Merlin Properties Socimi, S.A.
- 6.3.18 Alstria Office AG
- 6.3.19 BNP Paribas Real Estate
- 6.3.20 PATRIZIA
7 Market Opportunities & Future Outlook

