PUBLISHER: Mordor Intelligence | PRODUCT CODE: 2116359

PUBLISHER: Mordor Intelligence | PRODUCT CODE: 2116359
United Kingdom Office Real Estate - Market Share Analysis, Industry Trends & Statistics, Growth Forecasts (2026 - 2031)
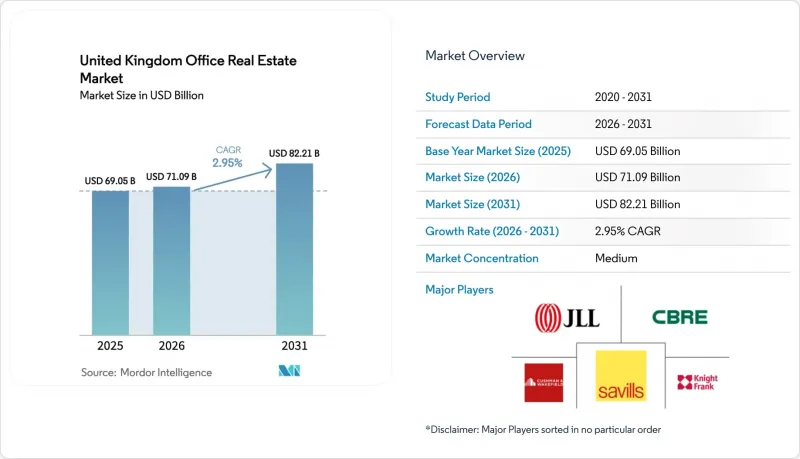
According to Mordor Intelligence, United Kingdom office real estate market size in 2026 is estimated at USD 71.09 billion, growing from 2025 value of USD 69.05 billion with 2031 projections showing USD 82.21 billion, growing at 2.95% CAGR over 2026-2031.
This report is Segmented by by Building Grade (Grade A, Grade B, and More), by Transaction Type (Rental and Sales), by End Use (Information Technology (IT & ITES), BFSI (Banking, Financial Services and Insurance), and More) and by Country (England, Scotland, and More). The Report Offers Market Size and Forecasts in Value (USD) for all the Above Segments.
United Kingdom Office Real Estate Market Trends and Insights
Renewed Demand for High-Quality Office Space in a Hybrid Work Environment
Mandatory office days have prompted firms to pay for buildings that reward the commute. A peer-reviewed study in Nature found that hybrid arrangements cut employee turnover by one-third without hurting output, with the largest advantages for non-managers, women and staff facing long journeys. ONS data confirm the tilt toward knowledge industries, where 42% of information and communication employees and 42% of professional, scientific and technical workers now follow hybrid models. People with university degrees are 10 times more likely to work this way than those without qualifications, pushing firms to treat the office as a talent platform rather than a fixed cost. Buildings that offer strong digital infrastructure, wellness features and ESG credentials therefore command premium rents.
Sustainability Regulations Driving Demand for Energy-Efficient Buildings
Minimum Energy Efficiency Standards are splitting the market. In Q1 2025, 466,000 Energy Performance Certificates were filed in England and Wales and 84% of new properties scored an A or B rating, underscoring the pace of transition. Academic work shows that certified "green" offices lease faster and sell at higher prices than non-certified stock, with LEED buildings enjoying clear valuation gains. Research also links stronger sustainability disclosure with better operating income and higher enterprise value, encouraging owners to upgrade rather than accept "brown" discounts.
Cost Pressures Impacting Development Viability
Inflation in labour and materials joins higher financing costs to push speculative development to a 13-year low, leaving only 1.5 million square feet under construction in regional cities. Developers now require larger pre-lets to de-risk projects, and prime regional yields have risen to 6.75%. Smaller sponsors without institutional backing are ceding ground, enabling well-capitalized firms to acquire stalled schemes at discounts. Until cost curves normalise, the imbalance favours existing landlords and constrains total output.
Other drivers and restraints analyzed in the detailed report include:
- Adaptive Reuse of Commercial Spaces Supporting Office Supply Growth
- Expansion of Flexible Workspace Models in Emerging Markets
- Compliance Challenges for Aging Office Stock
For complete list of drivers and restraints, kindly check the Table Of Contents.
Segment Analysis
Grade A offices held a commanding 64.74% of UK office real estate market share in 2025. Demand for these high-spec assets is projected to rise at a 3.28% CAGR through 2031 as firms embed hybrid work and ESG goals into portfolio strategy. Energy-certified buildings typically match or exceed conventional stock on net operating income and total return while trading at tighter cap rates. Government statistics show 84% of new English offices achieved an A or B energy rating in Q1 2025, confirming the rapid shift toward high-performance inventory.
Grade B space now faces material obsolescence risk: owners must fund mechanical upgrades or reposition assets entirely. Grade C buildings carry the heaviest burden; many require full retrofit or repurposing. A meta-review found that sustainability certifications deliver average sales premiums of 9.54% and rent premiums of 12.10%, with the office segment showing the greatest price sensitivity. As smart-building controls and wellness amenities move from novelty to baseline expectation, the gulf between premium and secondary stock will keep widening.
Complete Report Scope:
- By Building Grade
- Grade A
- Grade B
- Grade C
- By Transaction Type
- Rental
- Sales
- By End Use
- Information Technology (IT & ITES)
- BFSI
- Business Consulting & Professional Services
- Other Services (Retail,Lifesciences, Energy, Legal)
- By Country
- England
- London
- Rest of England
- Scotland
- Wales
- Northern Ireland
- England
List of Companies Covered in this Report:
- CBRE
- Jones Lang LaSalle IP, Inc.
- Savills
- Knight Frank
- Cushman & Wakefield
- Colliers International UK
- Lambert Smith Hampton
- BNP Paribas Real Estate UK
- Landsec
- British Land
- Canary Wharf Group
- Great Portland Estates (GPE)
- Derwent London
- SEGRO plc
- Lendlease Europe
- Hines United Kingdom
- Brookfield Properties UK
- Kajima Estates
- SevenCapital
- LBS Properties
- Salboy Ltd
- Schroder Real Estate
Additional Benefits:
- The market estimate (ME) sheet in Excel format
- 3 months of analyst support
TABLE OF CONTENTS
1 Introduction
- 1.1 Study Assumptions & Market Definition
- 1.2 Scope of the Study
2 Research Methodology
3 Executive Summary
4 Market Insights and Dynamics
- 4.1 Market Overview
- 4.2 Market Drivers
- 4.2.1 Renewed Demand for High-Quality Office Space in a Hybrid Work Environment
- 4.2.2 Sustainability Regulations Driving Demand for Energy-Efficient Buildings
- 4.2.3 Adaptive Reuse of Commercial Spaces Supporting Office Supply Growth
- 4.2.4 Expansion of Flexible Workspace Models in Emerging Markets
- 4.2.5 Regional Market Growth Supported by Government Investment
- 4.3 Market Restraints
- 4.3.1 Cost Pressures Impacting Development Viability
- 4.3.2 Compliance Challenges for Aging Office Stock
- 4.3.3 Weakened Leasing Demand from Public Sector Tenants
- 4.4 Value / Supply-Chain Analysis
- 4.4.1 Overview
- 4.4.2 Real Estate Developers and Contractors - Key Quantitative and Qualitative Insights
- 4.4.3 Architectural and Engineering Companies - Key Quantitative and Qualitative Insights
- 4.4.4 Building Material and Equipment Companies - Key Quantitative and Qualitative Insights
- 4.5 Government Regulations and Initiatives in the Industry
- 4.6 Technological Innovations in the Office Real Estate Market
- 4.7 Insights into Rental Yields in the Office Real Estate Segment
- 4.8 Insights into the Key Office Real Estate Industry Metrics (Supply, Rentals, Prices, Occupancy/Vacancy (%))
- 4.9 Insights into Office Real Estate Construction Costs
- 4.10 Insights into Office Real Estate Investment
- 4.11 Impact of Remote Working on Space Demand
- 4.12 Porter's Five Forces
- 4.12.1 Threat of New Entrants
- 4.12.2 Bargaining Power of Buyers / Occupiers
- 4.12.3 Bargaining Power of Developers / Landlords
- 4.12.4 Threat of Substitutes (WFH, Flexible Space)
- 4.12.5 Competitive Rivalry
5 Market Size & Growth Forecasts (Value, in USD)
- 5.1 By Building Grade
- 5.1.1 Grade A
- 5.1.2 Grade B
- 5.1.3 Grade C
- 5.2 By Transaction Type
- 5.2.1 Rental
- 5.2.2 Sales
- 5.3 By End Use
- 5.3.1 Information Technology (IT & ITES)
- 5.3.2 BFSI
- 5.3.3 Business Consulting & Professional Services
- 5.3.4 Other Services (Retail,Lifesciences, Energy, Legal)
- 5.4 By Country
- 5.4.1 England
- 5.4.1.1 London
- 5.4.1.2 Rest of England
- 5.4.2 Scotland
- 5.4.3 Wales
- 5.4.4 Northern Ireland
- 5.4.1 England
6 Competitive Landscape
- 6.1 Market Concentration
- 6.2 Strategic Moves
- 6.3 Company Profiles (includes Global-level Overview, Market-level Overview, Core Segments, Financials, Strategic Information, Market Rank/Share, Products & Services, Recent Developments)
- 6.3.1 CBRE
- 6.3.2 Jones Lang LaSalle IP, Inc.
- 6.3.3 Savills
- 6.3.4 Knight Frank
- 6.3.5 Cushman & Wakefield
- 6.3.6 Colliers International UK
- 6.3.7 Lambert Smith Hampton
- 6.3.8 BNP Paribas Real Estate UK
- 6.3.9 Landsec
- 6.3.10 British Land
- 6.3.11 Canary Wharf Group
- 6.3.12 Great Portland Estates (GPE)
- 6.3.13 Derwent London
- 6.3.14 SEGRO plc
- 6.3.15 Lendlease Europe
- 6.3.16 Hines United Kingdom
- 6.3.17 Brookfield Properties UK
- 6.3.18 Kajima Estates
- 6.3.19 SevenCapital
- 6.3.20 LBS Properties
- 6.3.21 Salboy Ltd
- 6.3.22 Schroder Real Estate
7 Market Opportunities & Future Outlook

