PUBLISHER: Mordor Intelligence | PRODUCT CODE: 2116422

PUBLISHER: Mordor Intelligence | PRODUCT CODE: 2116422
China Office Real Estate - Market Share Analysis, Industry Trends & Statistics, Growth Forecasts (2026 - 2031)
According to Mordor Intelligence, the China office real estate market size is expected to grow from USD 287.32 billion in 2025 to USD 301.89 billion in 2026 and is forecast to reach USD 386.48 billion by 2031 at 5.07% CAGR over 2026-2031.
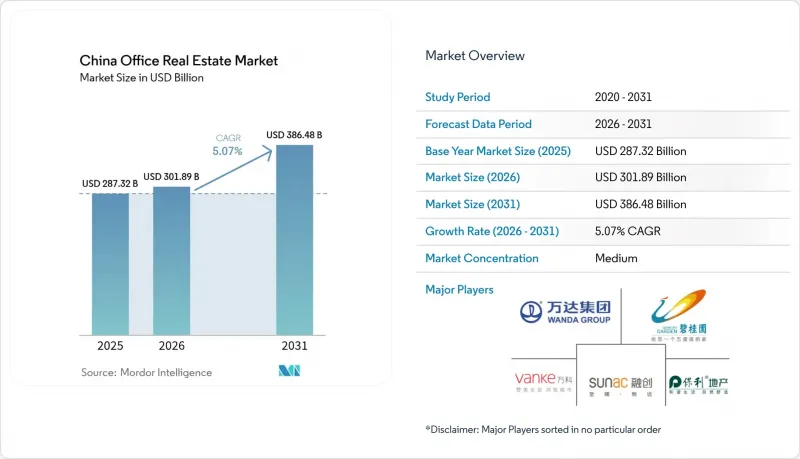
This report is Segmented by Building Grade (Grade A, Grade B, and More), by Transaction Type (Rental and Sales), by End Use (Information Technology (IT & ITES), BFSI (Banking, Financial Services and Insurance), and More) and by Major Cities (Beijing, Shanghai, Shenzhen and More). The Report Offers Market Size and Forecasts in Value (USD) for all the Above Segments.
China Office Real Estate Market Trends and Insights
Government Stimulus for REIT Expansion
The broadening of China's public REIT regime to encompass shopping malls and department stores has transformed how commercial assets secure long-term capital. Allowing investors to trade securitised stakes in stabilized projects tackles the duration mismatch between short-term bank debt and multi-decade real-estate income streams. The timing dovetails with a measured easing of "three red lines" tests for qualified asset takeovers, yielding a coordinated liquidity backstop that supports asset repricing without undermining financial-stability goals. As domestic investors already account for more than 80% of deal flow, the upgraded REIT channel furnishes them with scalable exit routes while giving developers an alternative to on-balance-sheet borrowing. Tier-1 properties stand to benefit first because they offer the cash-flow visibility demanded by institutional allocators.
Hybrid-Work-Led Flight to Quality Demand
Post-pandemic occupancy surveys show that employees are willing to return only to workspaces that improve well-being and collaboration; employers consequently rationalise footprints yet upgrade locations. This pivot has lifted Grade A effective rents by 2.4% since 2023 even as Grade B/C rates slipped 1.2%. Data from Hong Kong indicates 27% of staff would require minimum 6% pay increases to revert to a five-day office week, prompting companies to invest in amenities rather than compensation updates. In Shanghai, premium towers post an 11.5% vacancy rate, far below the city-wide 22.9% figure, underscoring an expanding premium-vs-secondary rent spread. The resulting bifurcation concentrates capital allocation on trophy assets and intensifies pressure on older stock to redevelop or reposition.
Persistent High Vacancy in Grade B/C Stock
Shanghai's non-CBD vacancy of 12.2% (versus 11.5% in Grade A core) illustrates how tenants siphon out of secondary assets, forcing landlords to grant concessions of up to 50% to hold occupiers. Beijing mirrors this gap, recording a 21% city-wide vacancy rate in 2024 despite stable demand from state-owned enterprises. Supply risks persist, with 953,000 m2 of new Shanghai Grade A completions hitting in 2H 2024, more than double 1H deliveries and compounding shadow stock burdens. Until owners recapitalise and reposition dated premises, structurally weaker cash flows will cap rent growth at the broader market level.
Other drivers and restraints analyzed in the detailed report include:
- Near-Shoring of Supply Chains to Interior Cities
- Digital-Services Uptake from Gen-AI Roll-Outs
- Tighter Developer Financing ("Three Red Lines")
For complete list of drivers and restraints, kindly check the Table Of Contents.
Segment Analysis
Grade A offices held a commanding 50.74% share of the China office real estate market in 2025, far surpassing other tiers. Driven by consolidating occupiers, the segment is forecast to expand at a 5.63% CAGR to 2031, consistently outpacing the broader China office real estate market size. Consolidation enables companies to curtail total square footage while elevating location quality, technology readiness, and ESG credentials. Landlords able to deliver WELL-categorized amenities such as touchless access, enhanced air filtration, and flexible meeting suites are commanding rent premiums of 10%-15% over 2023 pre-lease rates.
Class B assets face prolonged selection pressure, with many towers approaching functional obsolescence. Owners are considering conversions to co-warehousing, life-science incubators, or live-work lofts, yet such projects carry heavy capex. A cohort of investors has begun acquiring Class B/C bundles at discounts exceeding 35% of peak 2018 pricing, betting on urban-renewal benefits. The initiative dovetails with municipal guidance to re-energise dormant footprints, though regulatory permitting for structural retrofits remains a multi-year endeavour.
Complete Report Scope:
- By Building Grade
- Grade A
- Grade B
- Grade C
- By Transaction Type
- Rental
- Sales
- By End Use
- Information Technology (IT & ITES)
- BFSI (Banking, Financial Services and Insurance)
- Business Consulting & Professional Services
- Other Services (Retail, Lifescience, Energy, Legal)
- By Major Cities
- Beijing
- Shanghai
- Shenzhen
- Guangzhou
- Chengdu
- Rest of China
List of Companies Covered in this Report:
- WANDA Group
- Country Garden Property Development Co., Ltd
- Vanke Co., Ltd.
- Sunac China Holdings Limited
- Poly Developments & Holdings
- Evergrande Group
- China Overseas Land & Investment
- Greenland Holding Group
- China Resources Land
- China Merchants Shekou Industrial Zone
- Gemdale Corporation
- Henderson Land Development
- Longfor Group
- CapitaLand China
- Soho China
- Keppel REIT China
- Ping An Real Estate
- Tishman Speyer China
- Gaw Capital Partners
- Hines China
- Kerry Properties
- Swire Properties
Additional Benefits:
- The market estimate (ME) sheet in Excel format
- 3 months of analyst support
TABLE OF CONTENTS
1 Introduction
- 1.1 Study Assumptions & Market Definition
- 1.2 Scope of the Study
2 Research Methodology
3 Executive Summary
4 Market Insights and Dynamics
- 4.1 Market Overview
- 4.2 Market Drivers
- 4.2.1 Rapid expansion of domestic tech and fintech enterprises fueling Grade-A demand
- 4.2.2 Government-led urban cluster development (e.g., Greater Bay Area, Jing-Jin-Ji) boosting commercial hubs
- 4.2.3 Growing foreign enterprise presence in Tier-1 and select Tier-2 cities
- 4.2.4 Policy support for headquarters economy and innovation zones
- 4.2.5 Rising adoption of green buildings and smart office infrastructure
- 4.2.6 Increased co-working penetration in response to start-up ecosystem growth
- 4.3 Market Restraints
- 4.3.1 Oversupply pressure in Tier-2 and Tier-3 cities impacting rental growth
- 4.3.2 Economic slowdown and regulatory tightening affecting corporate leasing appetite
- 4.3.3 High vacancy rates in newly developed CBDs delaying absorption
- 4.3.4 Space rationalization by large occupiers due to hybrid work adoption
- 4.4 Value / Supply-Chain Analysis
- 4.4.1 Overview
- 4.4.2 Real Estate Developers and Contractors - Key Quantitative and Qualitative Insights
- 4.4.3 Architectural and Engineering Companies - Key Quantitative and Qualitative Insights
- 4.4.4 Building Material and Equipment Companies - Key Quantitative and Qualitative Insights
- 4.5 Government Regulations and Initiatives in the Industry
- 4.6 Technological Innovations in the Office Real Estate Market
- 4.7 Insights into Rental Yields in the Office Real Estate Segment
- 4.8 Insights into the Key Office Real Estate Industry Metrics (Supply, Rentals, Prices, Occupancy/Vacancy (%))
- 4.9 Insights into Office Real Estate Construction Costs
- 4.10 Insights into Office Real Estate Investment
- 4.11 Impact of Remote Working on Space Demand
- 4.12 Porter's Five Forces
- 4.12.1 Threat of New Entrants
- 4.12.2 Bargaining Power of Buyers / Occupiers
- 4.12.3 Bargaining Power of Developers / Landlords
- 4.12.4 Threat of Substitutes (WFH, Flexible Space)
- 4.12.5 Competitive Rivalry
5 Market Size & Growth Forecasts (USD Value)
- 5.1 By Building Grade
- 5.1.1 Grade A
- 5.1.2 Grade B
- 5.1.3 Grade C
- 5.2 By Transaction Type
- 5.2.1 Rental
- 5.2.2 Sales
- 5.3 By End Use
- 5.3.1 Information Technology (IT & ITES)
- 5.3.2 BFSI (Banking, Financial Services and Insurance)
- 5.3.3 Business Consulting & Professional Services
- 5.3.4 Other Services (Retail, Lifescience, Energy, Legal)
- 5.4 By Major Cities
- 5.4.1 Beijing
- 5.4.2 Shanghai
- 5.4.3 Shenzhen
- 5.4.4 Guangzhou
- 5.4.5 Chengdu
- 5.4.6 Rest of China
6 Competitive Landscape
- 6.1 Market Concentration
- 6.2 Strategic Moves
- 6.3 Company Profiles (includes Global-level Overview, Market-level Overview, Core Segments, Financials, Strategic Info, Market Rank/Share, Products & Services, Recent Developments)
- 6.3.1 WANDA Group
- 6.3.2 Country Garden Property Development Co., Ltd
- 6.3.3 Vanke Co., Ltd.
- 6.3.4 Sunac China Holdings Limited
- 6.3.5 Poly Developments & Holdings
- 6.3.6 Evergrande Group
- 6.3.7 China Overseas Land & Investment
- 6.3.8 Greenland Holding Group
- 6.3.9 China Resources Land
- 6.3.10 China Merchants Shekou Industrial Zone
- 6.3.11 Gemdale Corporation
- 6.3.12 Henderson Land Development
- 6.3.13 Longfor Group
- 6.3.14 CapitaLand China
- 6.3.15 Soho China
- 6.3.16 Keppel REIT China
- 6.3.17 Ping An Real Estate
- 6.3.18 Tishman Speyer China
- 6.3.19 Gaw Capital Partners
- 6.3.20 Hines China
- 6.3.21 Kerry Properties
- 6.3.22 Swire Properties
7 Market Opportunities & Future Outlook

