PUBLISHER: Mordor Intelligence | PRODUCT CODE: 2117252

PUBLISHER: Mordor Intelligence | PRODUCT CODE: 2117252
Asia-Pacific Office Real Estate - Market Share Analysis, Industry Trends & Statistics, Growth Forecasts (2026 - 2031)
According to Mordor Intelligence, the Asia-Pacific office real estate market size is projected to expand from USD 391.07 billion in 2025 and USD 412.12 billion in 2026 to USD 535.61 billion by 2031, registering a CAGR of 5.38% between 2026 to 2031.
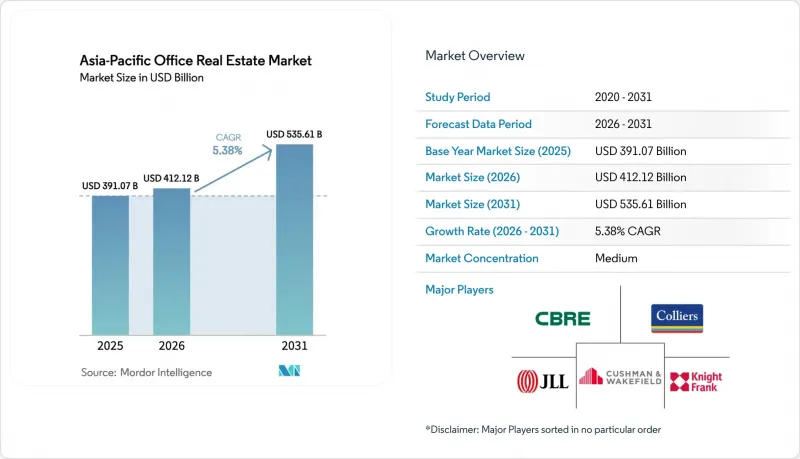
This report is Segmented by Business Model (Sales, Rental), by Building Grade (Grade A, Grade B, Grade C), by End Use (IT & ITES, BFSI, Business Consulting & Professional Services, Other Services), and by Geography (China, India, Japan, South Korea, Australia, Indonesia, Rest of Asia-Pacific). The Market Forecasts are Provided in Terms of Value (USD).
Asia-Pacific Office Real Estate Market Trends and Insights
Economic Diversification and Services Growth In India And Southeast Asia: Sustaining Net Absorption
Global-capability centers added 1.9 million employees across Bengaluru, Hyderabad, and Pune in 2024, and state incentives such as Karnataka's "Beyond Bengaluru" scheme continue to reduce stamp duty for compliant developers. Jakarta, Ho Chi Minh City, and Manila replicate this pattern with robust population growth and constrained Grade-A supply that keeps vacancy near single digits. Employers favor these metros for deep talent pools and tax perks, which together extend the demand runway well beyond 2028. Consequently, net absorption outpaces new completions in cost-advantaged corridors even while some Tier-1 Chinese submarkets struggle with oversupply. The dynamic signals durable occupier confidence despite the macro-rate environment.
Flight-To-Quality And Green Premiums Elevating Grade-A Demand
More than 51% of regional inventory carried a formal sustainability label in 2024 after Singapore required Green Mark certification for new projects above 5,000 m2. Tokyo and Hong Kong each report green penetration above 90%, and landlords command premiums that vary from 1 % in secondary nodes to 4 % in prime CBDs. For every five square feet of tenants' requests for fully certified assets, only two square feet are presently available, so occupiers lock in longer leases or pre-commit to projects under construction. Tight certified supply accelerates the obsolescence cycle for older buildings and incentivizes capital recycling into retrofit funds. As disclosure mandates tighten across Australia and Japan, green premiums are expected to widen, reinforcing the landlord flight-to-quality thesis.
Hybrid Work and Densification: Reducing Per-Employee Space Needs
Average allocations fell from 150-200 ft2 per employee before 2020 to 100-150 ft2 in 2024, a 33% contraction that immediately softens headline demand. Sydney and Melbourne report 30-40% vacancy in older towers as tenants retreat to fewer, amenity-rich floors. Survey data show peak occupancy above 80% in only 43% of monitored buildings, leaving structurally underused stock. Tokyo companies now average 1.3 staff per desk, letting occupiers surrender entire floors while maintaining headcount. Buildings without transit adjacency or wellness features suffer the sharpest occupancy erosion, pressuring rents and reducing asset liquidity.
Other drivers and restraints analyzed in the detailed report include:
- Tech, GCC, And Life-Sciences Expansion in Cost-Advantaged Markets
- Flexible Workspace Models Supporting Hybrid Operating Patterns
- Elevated Financing Costs and Construction Inflation Compressing Supply Economics
For complete list of drivers and restraints, kindly check the Table Of Contents.
Segment Analysis
Rental transactions captured 77.2% of 2025 turnover, confirming that the Asia-Pacific office real estate market prefers predictable, lease-backed cash flows. Institutional owners value 5-7-year average lease lengths in India and 3-5-year terms in Southeast Asia that mute near-term revenue volatility. REITs rebalanced USD 3.5 billion of portfolios in 2024, typified by Keppel REIT's purchase of a 50% interest in Mumbai's Pinnacle Office Park for SGD 239 million (USD 177 million). Sales transactions, only 22.8% by value, are nonetheless forecast to advance at a 6.71% CAGR, led by strata-title deals in Jakarta, where the Golden Indonesia visa encourages offshore ownership. Rental yields compress to 3.0-3.5% in Tokyo and 3.5-4.5% in Singapore, while Mumbai and Jakarta still trade near 8-9.5%, attracting yield-hungry foreign funds despite currency risk.
Core investors continue to chase stabilized portfolios, whereas value-add capital focuses on assets that can be repositioned for flexible workspace or upgraded to higher green certifications. The differential between Grade-A and Grade-B rents widens most in Singapore and Tokyo, encouraging developers to monetize completed buildings outright even as they retain management contracts. Over the forecast horizon, the Asia-Pacific office real estate market size for rental assets is projected to climb steadily, while the sales tranche benefits from opportunistic pricing in select metros.
Complete Report Scope:
- By Business Model
- Sales
- Rental
List of Companies Covered in this Report:
- JLL
- CBRE
- Cushman & Wakefield
- Colliers
- Knight Frank
- Savills
- Mitsubishi Estate
- DLF
- Henderson Land Development
- Frasers Property
- China Resources Land
- Keppel REIT
- Suntec REIT
- CDL
- Tata Realty & Infrastructure
- CapitaLand Development
- Lendlease
- GPT Group
- IGIS Asset Management
- Tokyu Fudosan Holdings
Additional Benefits:
- The market estimate (ME) sheet in Excel format
- 3 months of analyst support
TABLE OF CONTENTS
1 Introduction
- 1.1 Study Assumptions & Market Definition
- 1.2 Scope of the Study
2 Research Methodology
3 Executive Summary
4 Market Insights and Dynamics
- 4.1 Market Overview
- 4.2 Market Drivers
- 4.2.1 Economic diversification and services growth in India/SEA sustaining net absorption in select metros.
- 4.2.2 Flight-to-quality/green premium: tenants upgrading to energy-efficient, WELL-certified Grade-A space.
- 4.2.3 Tech, GCCs, and life sciences expanding in cost-advantaged markets (Hyderabad, Bengaluru, Ho Chi Minh City).
- 4.2.4 Flexible workspace, managed offices, and turnkey fit-outs meeting hybrid demand and shorter lease cycles.
- 4.2.5 Data-led asset management (IoT, smart BMS) improving NOI via energy savings and predictive maintenance.
- 4.3 Market Restraints
- 4.3.1 Hybrid work and densification reducing per-employee space needs and slowing headline demand.
- 4.3.2 Elevated financing costs and construction inflation pressuring new supply economics and refurb capex.
- 4.3.3 Oversupply/legacy stock obsolescence in CBDs, with slow permitting for conversions in some cities.
- 4.4 Value / Supply-Chain Analysis
- 4.4.1 Overview
- 4.4.2 Real Estate Developers and Contractors - Key Quantitative and Qualitative Insights
- 4.4.3 Architectural and Engineering Companies - Key Quantitative and Qualitative Insights
- 4.4.4 Building Material and Equipment Companies - Key Quantitative and Qualitative Insights
- 4.5 Government Regulations and Initiatives in the Industry
- 4.6 Technological Innovations in the Office Real Estate Market
- 4.7 Insights into Rental Yields in the Office Real Estate Segment
- 4.8 Insights into the Key Office Real Estate Industry Metrics (Supply, Rentals, Prices, Occupancy/Vacancy (%))
- 4.9 Insights into Office Real Estate Construction Costs
- 4.10 Insights into Office Real Estate Investment
- 4.11 Impact of Remote Working on Space Demand
- 4.12 Porter's Five Forces
- 4.12.1 Bargaining Power of Suppliers
- 4.12.2 Bargaining Power of Buyers
- 4.12.3 Threat of New Entrants
- 4.12.4 Threat of Substitutes
- 4.12.5 Intensity of Competitive Rivalry
5 Asia-Pacific Office Real Estate Market Size & Growth Forecasts (Value USD billion)
- 5.1 By Business Model
- 5.1.1 Sales
- 5.1.2 Rental
6 Asia-Pacific Office Real Estate Market (Rental Model) Size & Growth Forecasts (Value USD billion)
- 6.1 By Building Grade
- 6.1.1 Grade A
- 6.1.2 Grade B
- 6.1.3 Grade C
- 6.2 By End Use
- 6.2.1 Information Technology (IT & ITES)
- 6.2.2 BFSI
- 6.2.3 Business Consulting & Professional Services
- 6.2.4 Other Services (Retail, Life-science, Energy, Legal)
- 6.3 By Country
- 6.3.1 China
- 6.3.2 India
- 6.3.3 Japan
- 6.3.4 South Korea
- 6.3.5 Australia
- 6.3.6 Indonesia
- 6.3.7 Rest of Asia-Pacific
7 Competitive Landscape
- 7.1 Market Concentration
- 7.2 Strategic Moves
- 7.3 Market Share Analysis
- 7.4 Company Profiles (includes Global level Overview, Market level overview, Core Segments, Financials as available, Strategic Information, Products & Services, and Recent Developments)
- 7.4.1 JLL
- 7.4.2 CBRE
- 7.4.3 Cushman & Wakefield
- 7.4.4 Colliers
- 7.4.5 Knight Frank
- 7.4.6 Savills
- 7.4.7 Mitsubishi Estate
- 7.4.8 DLF
- 7.4.9 Henderson Land Development
- 7.4.10 Frasers Property
- 7.4.11 China Resources Land
- 7.4.12 Keppel REIT
- 7.4.13 Suntec REIT
- 7.4.14 CDL
- 7.4.15 Tata Realty & Infrastructure
- 7.4.16 CapitaLand Development
- 7.4.17 Lendlease
- 7.4.18 GPT Group
- 7.4.19 IGIS Asset Management
- 7.4.20 Tokyu Fudosan Holdings
8 Market Opportunities & Future Outlook

