PUBLISHER: Mordor Intelligence | PRODUCT CODE: 2119726

PUBLISHER: Mordor Intelligence | PRODUCT CODE: 2119726
United States Data Center Server - Market Share Analysis, Industry Trends & Statistics, Growth Forecasts (2026 - 2031)
According to Mordor Intelligence, the United States data center server market size in 2026 is estimated at USD 33.92 billion, growing from 2025 value of USD 31.29 billion with 2031 projections showing USD 50.83 billion, growing at 8.42% CAGR over 2026-2031.
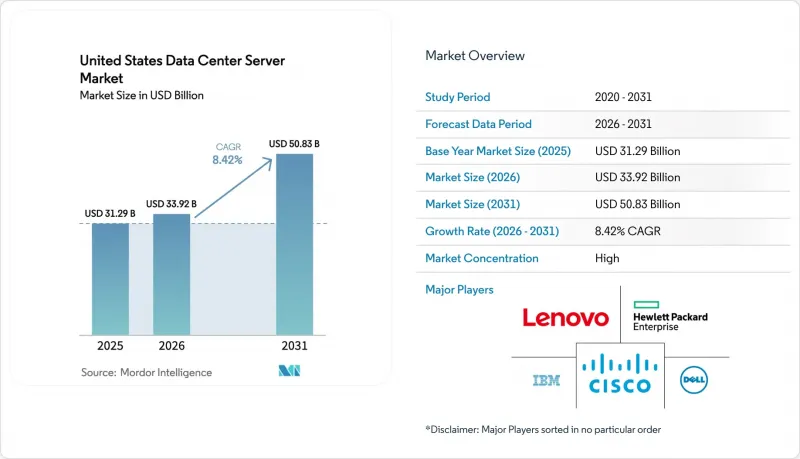
This report Segments the Industry Into Type (Tier 1, Tier 2, and More), Form Factor(Half-Height Blades, and More), End-User Verticals (BFSI, Manufacturing, and More), Data Center Type(Hyperscalers/Cloud Service Provider, and More) and by Application / Workload (Virtualisation and Private Cloud, Storage-Centric and More). The Market Forecasts are Provided in Terms of Value (USD).
United States Data Center Server Market Trends and Insights
Rapid hyperscaler CAPEX cycle renewal
Amazon, Microsoft, Google, and Meta collectively plan to spend more than USD 320 billion on data centers in 2025, extending server replacement cycles to five years as firms pursue AI compute density. Amazon's USD 100 billion allocation alone is estimated to add a USD 700 million operating-income drag due to accelerated depreciation, yet it shortens payback periods for advanced liquid-cooled racks. Federal agencies are mirroring the trend; sixteen Department of Energy sites have been fast-tracked for server-dense builds, with online availability expected by 2027, reinforcing demand peaks in Virginia and Oregon.
Enterprise AI/ML workload proliferation
Financial institutions cite an 84% concern among executives over catastrophic data loss if AI infrastructure falls short. Accuracy levels of only 21% in banking models spur investment in servers optimized for vector processing and larger memory footprints. Healthcare systems leverage AI for diagnostics and documentation, driving rack densities up to 50 kW. Manufacturing groups are adopting Industry 4.0 applications on edge nodes, combining 5G and micro-data center form factors. Lenovo's ThinkSystem V4 platform achieves 2.5X rack density and 2.4X performance-per-watt gains, underscoring its efficiency goals.
Rising frequency and cost of cyber-intrusions
Average breach costs of USD 5.56 million in 2024, combined with downtime expenses exceeding USD 100,000 per event, elevate the total cost of ownership. Forty-two percent of banks have migrated AI workloads away from public clouds due to security concerns, prompting on-premises build-outs that lengthen procurement cycles and increase CapEx. Ransomware events, such as CloudNordic's total customer data loss, illustrate worst-case scenarios compelling wider adoption of zero-trust architectures and biometric access controls.
Other drivers and restraints analyzed in the detailed report include:
- Edge-cloud convergence boosting micro-server demand
- Government incentives for domestic semiconductor manufacturing
- Supply-chain volatility for key silicon (HBM, GPUs)
For complete list of drivers and restraints, kindly check the Table Of Contents.
Segment Analysis
Tier 3 installations delivered 65.70% of revenue in 2025, anchoring the United States data center server market. Tier 4, though smaller, is projected to rise at 12.79% CAGR as hyperscalers assign AI training clusters to fully fault-tolerant halls where a single outage can cost over USD 100,000. The United States data center server market size contribution from Tier 4 is projected to grow steeply between 2026 and 2031. Federal programs that earmark sixteen sites for AI-ready builds favor Tier 4 specifications, given 50 kW-per-rack power densities anticipated by 2027.
Tier 1 and Tier 2 designs remain relevant for distributed edge nodes prioritizing cost efficiency over maximum redundancy. Financial-services migration toward Tier 4 also stems from stricter compliance and rising breach penalties. Altogether, the resilience imperative cements Tier 4 as the fastest-moving slice, reshaping colocation upgrade roadmaps and guiding liquid-cooling retrofits.
Half-height blades retained 48.54% market share in 2025 on the strength of virtualization workloads. Yet quarter-height micro-blades are climbing at 13.87% CAGR as operators compress racks into 20-foot edge modules. The United States data center server market size for micro-blade deployments is thus on an upward trajectory through 2031. EdgeMicro's city-center installs and manufacturing-sector Industry 4.0 pilots highlight the swing toward compact, energy-efficient hardware.
Full-height blades continue serving HPC clusters, but power-per-rack limits increasingly favor micro-blades paired with direct-to-chip liquid cooling. Hyperscalers are selectively adopting micro-blade platforms for AI inference nodes, balancing density against memory bandwidth needs.
Complete Report Scope:
- By Data-Center Tier
- Tier 1 and 2
- Tier 3
- Tier 4
- By Form Factor
- Half-height Blades
- Full-height Blades
- Quarter-height / Micro-blades
- By Application / Workload
- Virtualisation and Private Cloud
- High-Performance Computing (HPC)
- Artificial Intelligence/Machine Learning and Data Analytics
- Storage-centric
- Edge / IoT Gateways
- By Data Center Type
- Hyperscalers/Cloud Service Provider
- Colocation Facilities
- Enterprise and Edge
- By End-use Industry
- BFSI
- IT and Telecom
- Healthcare and Life-Sciences
- Manufacturing and Industry 4.0
- Energy and Utilities
- Government and Defence
List of Companies Covered in this Report:
- Dell Technologies Inc.
- Hewlett Packard Enterprise Company
- Lenovo Group Limited
- International Business Machines Corporation
- Cisco Systems, Inc.
- Super Micro Computer, Inc.
- Inspur Electronic Information Industry Co., Ltd.
- Quanta Computer Inc.
- Huawei Technologies Co., Ltd.
- Kingston Technology Company, Inc.
- Amazon Web Services, Inc.
- NVIDIA Corporation
- Ampere Computing LLC
- ASUSTeK Computer Inc.
- Giga-byte Technology Co., Ltd.
- Foxconn Technology Group (Hon Hai Precision)
- Equinix, Inc. (Server designs for xScale)
- Penguin Computing, Inc.
- Celestica Inc.
- MiTAC Holdings Corporation (Tyan)
- OVH US LLC
Additional Benefits:
- The market estimate (ME) sheet in Excel format
- 3 months of analyst support
TABLE OF CONTENTS
1 INTRODUCTION
- 1.1 Study Assumptions and Market Definition
- 1.2 Scope of the Study
2 RESEARCH METHODOLOGY
3 EXECUTIVE SUMMARY
4 MARKET LANDSCAPE
- 4.1 Market Overview
- 4.2 Market Drivers
- 4.2.1 Rapid hyperscaler CAPEX cycle renewal
- 4.2.2 Enterprise AI/ML workload proliferation
- 4.2.3 Edge-cloud convergence boosting micro-server demand
- 4.2.4 Government incentives for domestic semiconductor/Server manufacturing
- 4.2.5 U.S. power-availability contracts favor liquid-cool-ready racks
- 4.2.6 Tier-2 city tax abatements attracting second-wave data-center builds
- 4.3 Market Restraints
- 4.3.1 Rising frequency and cost of cyber-intrusions
- 4.3.2 Supply-chain volatility for key silicon (HBM, GPUs)
- 4.3.3 Grid-interconnection delays exceeding 24-months in PJM and MISO
- 4.3.4 New EPA ENERGY STAR v4 idle-power caps constraining legacy refresh
- 4.4 Industry Value Chain Analysis
- 4.5 Regulatory Landscape
- 4.6 Technological Outlook
- 4.7 Porter's Five Forces
- 4.7.1 Threat of New Entrants
- 4.7.2 Bargaining Power of Buyers
- 4.7.3 Bargaining Power of Suppliers
- 4.7.4 Threat of Substitutes
- 4.7.5 Intensity of Competitive Rivalry
- 4.8 Assessment of the Impact on Macro Economic Trends on the Market
5 MARKET SIZE AND GROWTH FORECASTS (VALUES)
- 5.1 By Data-Center Tier
- 5.1.1 Tier 1 and 2
- 5.1.2 Tier 3
- 5.1.3 Tier 4
- 5.2 By Form Factor
- 5.2.1 Half-height Blades
- 5.2.2 Full-height Blades
- 5.2.3 Quarter-height / Micro-blades
- 5.3 By Application / Workload
- 5.3.1 Virtualisation and Private Cloud
- 5.3.2 High-Performance Computing (HPC)
- 5.3.3 Artificial Intelligence/Machine Learning and Data Analytics
- 5.3.4 Storage-centric
- 5.3.5 Edge / IoT Gateways
- 5.4 By Data Center Type
- 5.4.1 Hyperscalers/Cloud Service Provider
- 5.4.2 Colocation Facilities
- 5.4.3 Enterprise and Edge
- 5.5 By End-use Industry
- 5.5.1 BFSI
- 5.5.2 IT and Telecom
- 5.5.3 Healthcare and Life-Sciences
- 5.5.4 Manufacturing and Industry 4.0
- 5.5.5 Energy and Utilities
- 5.5.6 Government and Defence
6 COMPETITIVE LANDSCAPE
- 6.1 Market Concentration
- 6.2 Strategic Moves
- 6.3 Market Share Analysis
- 6.4 Company Profiles (includes Global level Overview, Market level overview, Core Segments, Financials as available, Strategic Information, Market Rank/Share, Products and Services, Recent Developments)
- 6.4.1 Dell Technologies Inc.
- 6.4.2 Hewlett Packard Enterprise Company
- 6.4.3 Lenovo Group Limited
- 6.4.4 International Business Machines Corporation
- 6.4.5 Cisco Systems, Inc.
- 6.4.6 Super Micro Computer, Inc.
- 6.4.7 Inspur Electronic Information Industry Co., Ltd.
- 6.4.8 Quanta Computer Inc.
- 6.4.9 Huawei Technologies Co., Ltd.
- 6.4.10 Kingston Technology Company, Inc.
- 6.4.11 Amazon Web Services, Inc.
- 6.4.12 NVIDIA Corporation
- 6.4.13 Ampere Computing LLC
- 6.4.14 ASUSTeK Computer Inc.
- 6.4.15 Giga-byte Technology Co., Ltd.
- 6.4.16 Foxconn Technology Group (Hon Hai Precision)
- 6.4.17 Equinix, Inc. (Server designs for xScale)
- 6.4.18 Penguin Computing, Inc.
- 6.4.19 Celestica Inc.
- 6.4.20 MiTAC Holdings Corporation (Tyan)
- 6.4.21 OVH US LLC
7 MARKET OPPORTUNITIES AND FUTURE OUTLOOK
- 7.1 White-space and Unmet-need Assessment

