PUBLISHER: Mordor Intelligence | PRODUCT CODE: 2187230

PUBLISHER: Mordor Intelligence | PRODUCT CODE: 2187230
Indonesia Freight and Logistics - Market Share Analysis, Industry Trends & Statistics, Growth Forecasts (2027 - 2032)
According to Mordor Intelligence, the Indonesia freight and logistics market size is expected to increase from USD 139.4 billion in 2026 to USD 148 billion in 2027 and reach USD 198.4 billion by 2032, growing at a CAGR of 6.04% over 2027-2032.
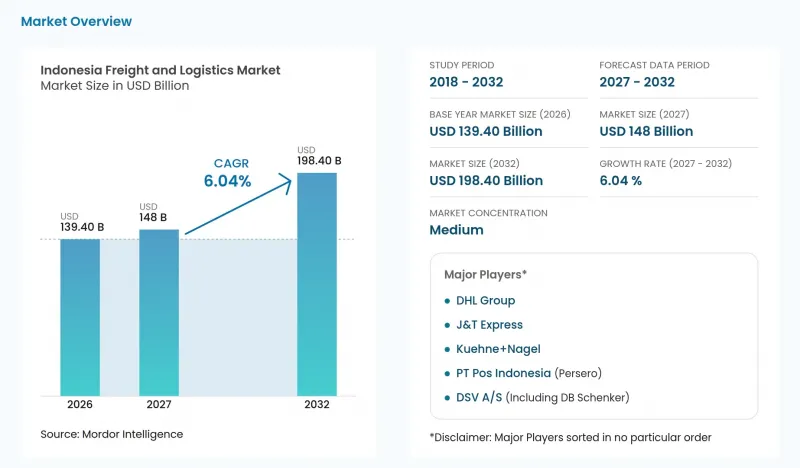
This report is segmented by End User Industry (Manufacturing, Wholesale and Retail Trade, and more) and Logistics Function (Freight Transport, Freight Forwarding, and more). The market forecasts are provided in terms of value (USD), based on availability.
Indonesia Freight and Logistics Market Trends and Insights
E-Commerce Boom and Parcel-Volume Surge
Online purchasing creates demand for both regular parcel handling and capacity that can absorb concentrated promotional peaks. Indonesia's e-commerce transaction frequency reached 1.44 billion in Q3 2025, up 20.5% year over year. J&T Express shipments in Indonesia increased up to 40% year over year on November 11, 2025, during the 11.11 e-commerce campaign. The combination supports investment in sorting and delivery capacity, with campaign exposure making flexibility as commercially relevant as average throughput. For parcel operators, matching additional processing capacity to these concentrated peaks can turn online purchasing growth into service revenue without making permanent capacity depend on a single promotional day.
Infrastructure Megaprojects (Toll Roads, Ports, Airports)
Indonesia's toll-road regulator reported that 95.49 kilometers of toll roads entered operation across 7 Indonesian toll roads in 2025. PT Hutama Marga Waskita opened the 10.15-kilometer Kuala Tanjung-Indrapura section in North Sumatra on March 9, 2025, initially without tolls. The operator said the link would reduce travel between Indrapura and Kuala Tanjung from 30 minutes to 10 minutes. The operator also described the section as connectivity toward Kuala Tanjung Port and Sei Mangkei Special Economic Zone. The operator's stated faster distribution toward the port and industrial zone gives shippers a shorter road option, supporting demand for trucking services along this North Sumatra corridor.
Severe Urban Congestion and Last-Mile Bottlenecks
Congestion can make the release of accumulated cargo a constraint on transport capacity rather than an immediate revenue opportunity. In April 2025, lifting a 16-day holiday truck ban triggered severe congestion at Tanjung Priok, causing 2-day logistics delays and estimated losses of IDR 120 billion (USD 7.4 million). The event illustrates how synchronized dispatch after a restriction can overload a gateway even when trucks are permitted to move again. For operators serving that gateway, delayed vehicle turnaround reduces the capacity available for subsequent collections and deliveries. Accepting additional loads after a restriction ends can increase a carrier's delivery commitments faster than usable capacity, raising the cost of restoring normal service.
Other drivers and restraints analyzed in the detailed report include:
- Manufacturing-Export Rebound (Autos, Electronics, Textiles)
- Rising Domestic Consumption and Middle-Class Spending
- Fragmented Regulations and Overlapping Licenses
For complete list of drivers and restraints, kindly check the Table Of Contents.
Segment Analysis
Manufacturing accounted for a 28.52% share of the Indonesia freight and logistics market size in 2026. The industry contributed 19.07% of national GDP in 2025, illustrating the industrial production base behind its position as the largest end-user segment. Indonesia's processing-industry exports totaled USD 159.6 billion in January-August 2026, up 7.87% from the same period in 2025. That export-facing production base favors logistics providers that can connect factory movements with international cargo handling, making cross-border execution an integral part of serving industrial customers and extending the relationship beyond domestic transport alone.
Wholesale and retail trade is the fastest-growing segment, with a forecast CAGR of 6.52% over 2027-2032. Indomaret opened 944 stores in Indonesia in 2025, bringing its retail network to more than 24,000 stores. The retailer also operated 37 distribution centers in 2025 to support distribution efficiency and product availability. The added outlets expand the retailer-run network's delivery obligations, tying retail-led logistics growth to store-level replenishment execution.
Complete Report Scope:
- By End User Industry
- Agriculture, Fishing, and Forestry
- Construction
- Manufacturing
- Oil and Gas, Mining and Quarrying
- Wholesale and Retail Trade
- Others
- By Logistics Function
- Courier, Express, and Parcel (CEP)
- By Destination Type
- Domestic
- International
- By Destination Type
- Freight Forwarding
- By Mode of Transport
- Air
- Sea and Inland Waterways
- Others
- By Mode of Transport
- Freight Transport
- By Mode of Transport
- Air
- Pipelines
- Rail
- Road
- Sea and Inland Waterways
- By Mode of Transport
- Warehousing and Storage
- By Temperature Control
- Non-Temperature Controlled
- Temperature Controlled
- By Temperature Control
- Other Services
- Courier, Express, and Parcel (CEP)
List of Companies Covered in this Report:
- DHL Group
- DSV A/S (Including DB Schenker)
- Expeditors International of Washington, Inc.
- FedEx
- J&T Express
- Kuehne+Nagel
- Linfox Pty Ltd.
- LOGWIN
- Ninja Van (Including Ninja Xpress)
- NYK (Nippon Yusen Kaisha) Line
- Pancaran Group
- PT ABM Investama TBK (including CKB Logistics)
- PT Bina Sinar Amity (BSA Logistics Indonesia)
- PT Cardig International
- PT Citrabati Logistik Internasional
- PT Dunia Express Transindo
- PT Jalur Nugraha Ekakurir (JNE Express)
- PT Kamadjaja Logistics
- PT Lautan Luas TBK
- PT Pandu Siwi Sentosa (Pandu Logistics)
- PT Perusahaan Perdagangan Indonesia (including BGR Indonesia)
- PT Pos Indonesia (Persero)
- PT Repex Wahana (RPX)
- PT Samudera Indonesia Tangguh
- PT Satria Antaran Prima TBK (SAPX Express)
- PT Siba Surya
- PT Soechi Lines Tbk
- Puninar Logistics
- SF Express (KEX-SF)
- Sinotrans, Ltd.
- United Parcel Service of America, Inc. (UPS)
Additional Benefits:
- The market estimate (ME) sheet in Excel format
- 3 months of analyst support
TABLE OF CONTENTS
1 INTRODUCTION
- 1.1 Study Assumptions and Market Definition
- 1.2 Scope of the Study
2 RESEARCH METHODOLOGY
3 EXECUTIVE SUMMARY
4 MARKET LANDSCAPE
- 4.1 Market Overview
- 4.2 Market Drivers
- 4.2.1 E-Commerce Boom and Parcel-Volume Surge
- 4.2.2 Infrastructure Megaprojects (Toll Roads, Ports, Airports)
- 4.2.3 Manufacturing-Export Rebound (Autos, Electronics, Textiles)
- 4.2.4 Rising Domestic Consumption and Middle-Class Spending
- 4.2.5 National Logistics Ecosystem (NLE) Digital Platform Rollout
- 4.2.6 Cold-Chain Demand from Aquaculture and Seafood Exports
- 4.3 Market Restraints
- 4.3.1 Severe Urban Congestion and Last-Mile Bottlenecks
- 4.3.2 Fragmented Regulations and Overlapping Licenses
- 4.3.3 High Fuel-Price Volatility
- 4.3.4 Shortage of Logistics-Tech Talent
- 4.4 Industry Value Chain Analysis
- 4.5 Regulatory Landscape
- 4.6 Technological Outlook
- 4.7 Porter's Five Forces Analysis
- 4.7.1 Threat of New Entrants
- 4.7.2 Bargaining Power of Suppliers
- 4.7.3 Bargaining Power of Buyers
- 4.7.4 Threat of Substitutes
- 4.7.5 Competitive Rivalry
- 4.8 Demographics
- 4.9 GDP Distribution by Economic Activity
- 4.10 GDP Growth by Economic Activity
- 4.11 Inflation
- 4.12 Economic Performance and Profile
- 4.12.1 Trends in E-Commerce Industry
- 4.12.2 Trends in Manufacturing Industry
- 4.13 Transport and Storage Sector GDP
- 4.14 Export Trends
- 4.15 Import Trends
- 4.16 Fuel Price
- 4.17 Trucking Operational Costs
- 4.18 Trucking Fleet Size By Type
- 4.19 Major Truck Suppliers
- 4.20 Logistics Performance
- 4.21 Modal Share
- 4.22 Maritime Fleet Load Carrying Capacity
- 4.23 Liner Shipping Connectivity
- 4.24 Port Calls And Performance
- 4.25 Freight Pricing Trends
- 4.26 Freight Tonnage Trends
- 4.27 Infrastructure
5 MARKET SIZE AND GROWTH FORECASTS (VALUE)
- 5.1 By End User Industry
- 5.1.1 Agriculture, Fishing, and Forestry
- 5.1.2 Construction
- 5.1.3 Manufacturing
- 5.1.4 Oil and Gas, Mining and Quarrying
- 5.1.5 Wholesale and Retail Trade
- 5.1.6 Others
- 5.2 By Logistics Function
- 5.2.1 Courier, Express, and Parcel (CEP)
- 5.2.1.1 By Destination Type
- 5.2.1.1.1 Domestic
- 5.2.1.1.2 International
- 5.2.1.1 By Destination Type
- 5.2.2 Freight Forwarding
- 5.2.2.1 By Mode of Transport
- 5.2.2.1.1 Air
- 5.2.2.1.2 Sea and Inland Waterways
- 5.2.2.1.3 Others
- 5.2.2.1 By Mode of Transport
- 5.2.3 Freight Transport
- 5.2.3.1 By Mode of Transport
- 5.2.3.1.1 Air
- 5.2.3.1.2 Pipelines
- 5.2.3.1.3 Rail
- 5.2.3.1.4 Road
- 5.2.3.1.5 Sea and Inland Waterways
- 5.2.3.1 By Mode of Transport
- 5.2.4 Warehousing and Storage
- 5.2.4.1 By Temperature Control
- 5.2.4.1.1 Non-Temperature Controlled
- 5.2.4.1.2 Temperature Controlled
- 5.2.4.1 By Temperature Control
- 5.2.5 Other Services
- 5.2.1 Courier, Express, and Parcel (CEP)
6 COMPETITIVE LANDSCAPE
- 6.1 Market Concentration
- 6.2 Strategic Moves
- 6.3 Market Share Analysis
- 6.4 Company Profiles (includes Global level Overview, Market level overview, Core Segments, Financials as available, Strategic Information, Market Rank/Share for key companies, Products and Services, and Recent Developments)
- 6.4.1 DHL Group
- 6.4.2 DSV A/S (Including DB Schenker)
- 6.4.3 Expeditors International of Washington, Inc.
- 6.4.4 FedEx
- 6.4.5 J&T Express
- 6.4.6 Kuehne+Nagel
- 6.4.7 Linfox Pty Ltd.
- 6.4.8 LOGWIN
- 6.4.9 Ninja Van (Including Ninja Xpress)
- 6.4.10 NYK (Nippon Yusen Kaisha) Line
- 6.4.11 Pancaran Group
- 6.4.12 PT ABM Investama TBK (including CKB Logistics)
- 6.4.13 PT Bina Sinar Amity (BSA Logistics Indonesia)
- 6.4.14 PT Cardig International
- 6.4.15 PT Citrabati Logistik Internasional
- 6.4.16 PT Dunia Express Transindo
- 6.4.17 PT Jalur Nugraha Ekakurir (JNE Express)
- 6.4.18 PT Kamadjaja Logistics
- 6.4.19 PT Lautan Luas TBK
- 6.4.20 PT Pandu Siwi Sentosa (Pandu Logistics)
- 6.4.21 PT Perusahaan Perdagangan Indonesia (including BGR Indonesia)
- 6.4.22 PT Pos Indonesia (Persero)
- 6.4.23 PT Repex Wahana (RPX)
- 6.4.24 PT Samudera Indonesia Tangguh
- 6.4.25 PT Satria Antaran Prima TBK (SAPX Express)
- 6.4.26 PT Siba Surya
- 6.4.27 PT Soechi Lines Tbk
- 6.4.28 Puninar Logistics
- 6.4.29 SF Express (KEX-SF)
- 6.4.30 Sinotrans, Ltd.
- 6.4.31 United Parcel Service of America, Inc. (UPS)
7 MARKET OPPORTUNITIES AND FUTURE OUTLOOK
- 7.1 White-Space and Unmet-Need Assessment

