PUBLISHER: Mordor Intelligence | PRODUCT CODE: 2187235

PUBLISHER: Mordor Intelligence | PRODUCT CODE: 2187235
United States Freight And Logistics - Market Share Analysis, Industry Trends & Statistics, Growth Forecasts (2027 - 2032)
According to Mordor Intelligence, the United States freight and logistics market size was valued at USD 1.43 trillion in 2026 and estimated to grow from USD 1.48 trillion in 2027 to reach USD 1.76 trillion by 2032, at a CAGR of 3.52% during the forecast period (2027-2032).
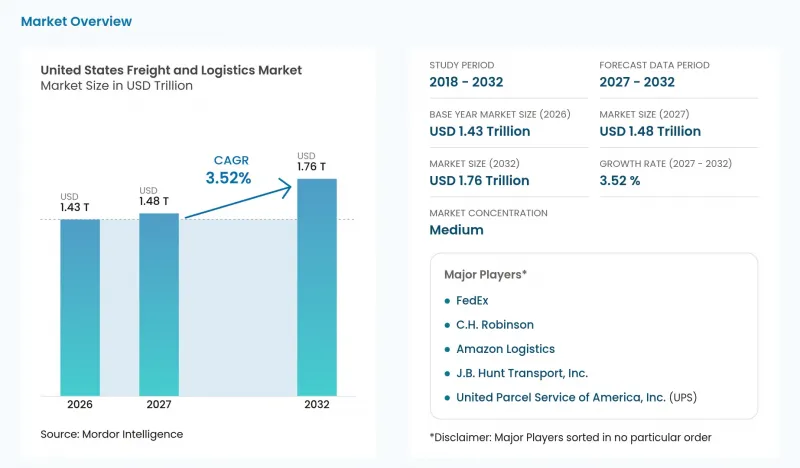
This report is segmented by End User Industry (Manufacturing, Wholesale and Retail Trade, and more) and Logistics Function (Freight Transport, Courier, Express, and Parcel, and more). The market forecasts are provided in terms of value (USD), based on availability.
United States Freight And Logistics Market Trends and Insights
Explosive B2C E-Commerce Parcel Volumes
Consumer-oriented parcel growth creates a demand opportunity at the operating-day level, where additional packages require handling and delivery capacity. FedEx's U.S. ground home delivery/economy average daily volume increased 5.7% in fiscal 2026, from 7.04 million packages in fiscal 2025 to 7.44 million. The company calculated that combined category's volumes using 5 days per week. The increase therefore describes a higher average processing requirement, making daily parcel throughput a relevant basis for matching service capacity to demand. The commercial opening lies in executing the extra home delivery/economy workload, with operating-day averages guiding the scale of the capacity response.
Reshoring-Driven Domestic Manufacturing Freight Flows
For freight providers, reshoring makes production location a commercial variable alongside the amount of goods produced. In the 2026 U.S. reshoring survey, 36% of OEM respondents reported having reshored or being actively engaged in additional reshoring, up from 29% in 2025. The survey covered 118 OEMs and 131 contract manufacturers among 249 respondents. Its combination of completed moves and active projects points toward service opportunities unfolding at different stages of implementation. Relocated production can therefore give carriers a route-development opportunity centered on the new industrial location and its supply and delivery connections.
Acute Long-Haul Driver Shortage and Wage Inflation
Driver compensation places a cost hurdle between truckload service expansion and commercially sustainable freight rates. For-hire truckload carriers paid dry van irregular-route employee drivers median annual compensation of USD 73,639 in 2025, 8.3% higher than in 2023. The carrier sample varied between the studies, and the measure covers total compensation for that specific driver category. A higher compensation bill raises the revenue needed to sustain service, limiting carriers' room to reduce freight prices. On October 1, 2026, Schneider announced a 26% increase in driver-instructor positions to expand training and onboarding capacity across its U.S. training locations. That proposed capacity response would leave carriers bearing the compensation costs associated with the drivers they employ.
Other drivers and restraints analyzed in the detailed report include:
- Expansion of 3PL/4PL Outsourcing Across Mid-Market Shippers
- Infrastructure Investment and Jobs Act (IIJA) Funding
- Port, Rail-Ramp and Urban Congestion Bottlenecks
For complete list of drivers and restraints, kindly check the Table Of Contents.
Segment Analysis
Manufacturing accounted for a 28.58% share of the United States freight and logistics market size in 2026, making it the largest segment. U.S. manufacturers shipped USD 7.24 trillion in goods in 2025, up 1.7% from 2024. Toyota Battery Manufacturing North Carolina, Toyota's in-house battery plant, began shipping batteries in April 2025. That shipment start provides an operating milestone for a manufactured product, linking production readiness to goods available for movement. Manufactured-goods shipments can create service revenue for logistics providers that secure movement contracts around an operating production flow and its delivery needs.
Wholesale and retail trade is forecast to grow at a CAGR of 3.82% during 2027-2032, making it the fastest-growing segment. In May 2026, Walmart announced a phased Prepaid Consolidation Program combining supplier shipments before distribution across its 42 U.S. regional distribution centers. Suppliers retain prepaid freight terms and arrange transportation, while Walmart manages consolidation and approved third-party logistics providers may participate. Eligibility prioritizes volume alignment and capacity expansion, requiring suppliers to explore whether they qualify. The opportunity for logistics suppliers lies in coordinating eligible inbound flows across that distribution network while preserving the supplier's responsibility for transportation.
Complete Report Scope:
- By End User Industry
- Agriculture, Fishing, and Forestry
- Construction
- Manufacturing
- Oil and Gas, Mining and Quarrying
- Wholesale and Retail Trade
- Others
- By Logistics Function
- Courier, Express, and Parcel (CEP)
- By Destination Type
- Domestic
- International
- By Destination Type
- Freight Forwarding
- By Mode of Transport
- Air
- Sea and Inland Waterways
- Others
- By Mode of Transport
- Freight Transport
- By Mode of Transport
- Air
- Pipelines
- Rail
- Road
- Sea and Inland Waterways
- By Mode of Transport
- Warehousing and Storage
- By Temperature Control
- Non-Temperature Controlled
- Temperature Controlled
- By Temperature Control
- Other Services
- Courier, Express, and Parcel (CEP)
List of Companies Covered in this Report:
- Amazon Logistics
- C.H. Robinson
- DHL Group
- DSV A/S (Including DB Schenker)
- Expeditors International of Washington, Inc.
- FedEx
- GXO Logistics, Inc.
- J.B. Hunt Transport, Inc.
- Kuehne+Nagel
- Landstar System, Inc.
- Lineage, Inc.
- A.P. Moller - Maersk
- NFI Industries
- Old Dominion Freight Line
- Penske Logistics
- Ryder System, Inc.
- Schneider National, Inc.
- SEKO Logistics
- United Parcel Service of America, Inc. (UPS)
- XPO, Inc.
Additional Benefits:
- The market estimate (ME) sheet in Excel format
- 3 months of analyst support
TABLE OF CONTENTS
1 INTRODUCTION
- 1.1 Study Assumptions and Market Definition
- 1.2 Scope of the Study
2 RESEARCH METHODOLOGY
3 EXECUTIVE SUMMARY
4 MARKET LANDSCAPE
- 4.1 Market Overview
- 4.2 Market Drivers
- 4.2.1 Explosive B2C E-Commerce Parcel Volumes
- 4.2.2 Reshoring-Driven Domestic Manufacturing Freight Flows
- 4.2.3 Expansion of 3PL/4PL Outsourcing Across Mid-Market Shippers
- 4.2.4 Infrastructure Investment and Jobs Act (IIJA) Funding
- 4.2.5 Digital Freight Marketplaces and API-Based Capacity Aggregation
- 4.2.6 Zero-Emission Truck Corridor Pilots (Hydrogen / BEV)
- 4.3 Market Restraints
- 4.3.1 Acute Long-Haul Driver Shortage and Wage Inflation
- 4.3.2 Port, Rail-Ramp and Urban Congestion Bottlenecks
- 4.3.3 Cyber-Risk Insurance and Compliance Costs
- 4.3.4 "Nuclear" Jury Verdicts Driving Motor-Carrier Insurance Spikes
- 4.4 Industry Value Chain Analysis
- 4.5 Regulatory Landscape
- 4.6 Technological Outlook
- 4.7 Porter's Five Forces Analysis
- 4.7.1 Threat of New Entrants
- 4.7.2 Bargaining Power of Suppliers
- 4.7.3 Bargaining Power of Buyers
- 4.7.4 Threat of Substitutes
- 4.7.5 Competitive Rivalry
- 4.8 Demographics
- 4.9 GDP Distribution by Economic Activity
- 4.10 GDP Growth by Economic Activity
- 4.11 Inflation
- 4.12 Economic Performance and Profile
- 4.12.1 Trends in E-Commerce Industry
- 4.12.2 Trends in Manufacturing Industry
- 4.13 Transport and Storage Sector GDP
- 4.14 Export Trends
- 4.15 Import Trends
- 4.16 Fuel Price
- 4.17 Trucking Operational Costs
- 4.18 Trucking Fleet Size by Type
- 4.19 Major Truck Suppliers
- 4.20 Logistics Performance
- 4.21 Modal Share
- 4.22 Maritime Fleet Load Carrying Capacity
- 4.23 Liner Shipping Connectivity
- 4.24 Port Calls and Performance
- 4.25 Freight Pricing Trends
- 4.26 Freight Tonnage Trends
- 4.27 Infrastructure
5 MARKET SIZE AND GROWTH FORECASTS (VALUE)
- 5.1 By End User Industry
- 5.1.1 Agriculture, Fishing, and Forestry
- 5.1.2 Construction
- 5.1.3 Manufacturing
- 5.1.4 Oil and Gas, Mining and Quarrying
- 5.1.5 Wholesale and Retail Trade
- 5.1.6 Others
- 5.2 By Logistics Function
- 5.2.1 Courier, Express, and Parcel (CEP)
- 5.2.1.1 By Destination Type
- 5.2.1.1.1 Domestic
- 5.2.1.1.2 International
- 5.2.1.1 By Destination Type
- 5.2.2 Freight Forwarding
- 5.2.2.1 By Mode of Transport
- 5.2.2.1.1 Air
- 5.2.2.1.2 Sea and Inland Waterways
- 5.2.2.1.3 Others
- 5.2.2.1 By Mode of Transport
- 5.2.3 Freight Transport
- 5.2.3.1 By Mode of Transport
- 5.2.3.1.1 Air
- 5.2.3.1.2 Pipelines
- 5.2.3.1.3 Rail
- 5.2.3.1.4 Road
- 5.2.3.1.5 Sea and Inland Waterways
- 5.2.3.1 By Mode of Transport
- 5.2.4 Warehousing and Storage
- 5.2.4.1 By Temperature Control
- 5.2.4.1.1 Non-Temperature Controlled
- 5.2.4.1.2 Temperature Controlled
- 5.2.4.1 By Temperature Control
- 5.2.5 Other Services
- 5.2.1 Courier, Express, and Parcel (CEP)
6 COMPETITIVE LANDSCAPE
- 6.1 Market Concentration
- 6.2 Strategic Moves
- 6.3 Market Share Analysis
- 6.4 Company Profiles (includes Global level Overview, Market level overview, Core Segments, Financials as available, Strategic Information, Market Rank/Share for key companies, Products and Services, and Recent Developments)
- 6.4.1 Amazon Logistics
- 6.4.2 C.H. Robinson
- 6.4.3 DHL Group
- 6.4.4 DSV A/S (Including DB Schenker)
- 6.4.5 Expeditors International of Washington, Inc.
- 6.4.6 FedEx
- 6.4.7 GXO Logistics, Inc.
- 6.4.8 J.B. Hunt Transport, Inc.
- 6.4.9 Kuehne+Nagel
- 6.4.10 Landstar System, Inc.
- 6.4.11 Lineage, Inc.
- 6.4.12 A.P. Moller - Maersk
- 6.4.13 NFI Industries
- 6.4.14 Old Dominion Freight Line
- 6.4.15 Penske Logistics
- 6.4.16 Ryder System, Inc.
- 6.4.17 Schneider National, Inc.
- 6.4.18 SEKO Logistics
- 6.4.19 United Parcel Service of America, Inc. (UPS)
- 6.4.20 XPO, Inc.
7 MARKET OPPORTUNITIES AND FUTURE OUTLOOK
- 7.1 White-Space and Unmet-Need Assessment

