PUBLISHER: Mordor Intelligence | PRODUCT CODE: 2187319

PUBLISHER: Mordor Intelligence | PRODUCT CODE: 2187319
Vietnam Foodservice - Market Share Analysis, Industry Trends & Statistics, Growth Forecasts (2027 - 2032)
According to Mordor Intelligence, the Vietnam foodservice market size was valued at USD 27.38 billion in 2026 and estimated to grow from USD 30.27 billion in 2027 to reach USD 49.02 billion by 2032, at a CAGR of 10.12% during the forecast period (2027-2032).
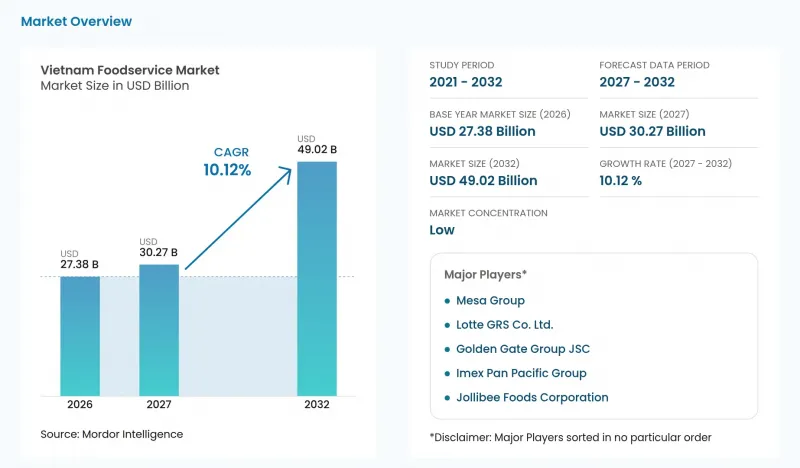
This report is segmented by Foodservice Type (Full Service Restaurants, Quick Service Restaurants, and more), Outlet (Independent Outlets and Chained Outlets), Locations (Standalone, Retail, and more), and Service Type (Dine-in, Takeaway, and more). The market forecasts are provided in terms of value (USD), based on availability.
Vietnam Foodservice Market Trends and Insights
Expansion and modernization of urban infrastructure
Urban rail investment can expand the locations where foodservice operators reach customers during recurring daily journeys. Hanoi held a groundbreaking ceremony for 5 urban metro lines totaling 298.5 kilometers on June 22, 2026. Once services begin, accessible station surroundings could support additional meal and beverage occasions by bringing customers within reach of nearby outlets. Restaurants considering these corridors would need service formats suited to passenger movements, with quick collection offering a way to serve journeys without requiring a prolonged visit. Station-area outlets could gain recurring short meal stops, but committing premises before usable transport access risks incurring site costs before passenger demand is available.
Rapid digitization and mobile app adoption for ordering
App-based ordering can make local restaurant offers easier to discover, giving operators a route to customers before a physical visit. Grab reported that new GrabFood merchant partners in Hue increased 57% in 2025 compared with 2024. Each participating restaurant can present a defined food offer through the ordering channel, allowing customers to consider it alongside other meal options. For smaller food businesses, this can widen discovery without requiring a second dining location, although the offer must still convert attention into completed orders. The demand benefit comes from making an existing kitchen easier to find and order from, so menu clarity becomes commercially relevant before service begins.
Supply chain fragility and ingredient sourcing challenges
Ingredient sourcing can constrain restaurant growth through both higher meal costs and interruptions upstream of the kitchen. In 2025, 69.38% of Vietnamese foodservice businesses surveyed by iPOS.vn and Nestle Professional faced pressure from sharply rising ingredient prices. USDA also reported that Vietnam's rapid January 2026 rollout of Decree 46 created logistical bottlenecks and food-ingredient importer hesitation during a peak-consumption period. For restaurants exposed to imported ingredients, such interruptions can complicate sourcing alongside the separate burden of more expensive menu inputs. Passing higher costs into meal prices risks weakening affordability, while absorbing them leaves less income to support expansion. This combination limits the amount of additional demand an operator can serve economically at its existing menu prices.
Other drivers and restraints analyzed in the detailed report include:
- Rise of cloud kitchens and virtual-only brands
- Increasing consumer preference for convenience and ready-to-eat food
- Pressure from multinational and domestic chains on smaller operators
For complete list of drivers and restraints, kindly check the Table Of Contents.
Segment Analysis
Full service restaurants accounted for a 67.28% share of the Vietnam foodservice market size in 2026. Golden Gate Group JSC's portfolio includes full service dining concepts such as GoGi House. In 2025, the group reported 23 million diners served through its overall 35-brand restaurant system. A multi-brand structure can address different restaurant propositions while bringing substantial operating experience to each concept. For full service operators, the commercial task is to give diners a clear reason to select a particular cuisine and occasion, making concept differentiation central to winning a deliberate restaurant visit.
Cloud kitchens are forecast to be the fastest-growing segment, at a CAGR of 18.2% during 2027-2032. The format concentrates spending on a production site and an off-premise customer proposition, making delivery performance part of the restaurant offer. Packaging and the interval between preparation and consumption become part of the meal experience the operator must design. A tightly defined menu can align preparation, packing, and expected delivery conditions around a consistent delivered meal. Because packaging and travel time shape the delivered meal, a cloud kitchen must favor dishes that withstand transit, narrowing its menu relative to a full service restaurant.
Independent outlets represented a 77.31% Vietnam foodservice market share in 2026. A 2025 VietNamNet profile described family-run Pho Lam in Hanoi as mainly serving regular customers and selling around 30-40 kilograms of rice noodles daily. Owner Vu Bao Lam said he kept sales at a set quantity to maintain quality. That choice makes the food offer and its recurring customers central to the shop's capacity decision. Pho Lam's cap traded potential extra volume for consistency, a choice suited to its regular-customer base but restrictive for growth from that single shop.
Chained outlets are forecast to be the fastest-growing segment, at a CAGR of 10.8% during 2027-2032. Jollibee Group reported on April 27, 2026, that Jollibee Vietnam had more than 250 stores across more than 50 provinces and cities. This network illustrates how a restaurant brand can reach customers through multiple points of service across a broad territory. Each additional outlet must reproduce the expected meal and service, making operating replication integral to the growth proposition. The advantage is a wider route to customers, provided that expansion preserves the reason diners choose the brand at each location and turns geographic reach into viable restaurant activity.
Complete Report Scope:
- By Foodservice Type
- Cafe and Bars
- By Cuisine
- Bars and Pubs
- Cafe
- Juice/Smoothie/Desserts Bars
- Specialist Coffee and Tea Shops
- By Cuisine
- Cloud Kitchen
- Full Service Restaurants
- By Cuisine
- Asian
- European
- Latin American
- Middle Eastern
- North American
- Other FSR Cuisines
- By Cuisine
- Quick Service Restaurants
- By Cuisine
- Bakeries
- Burger
- Ice Cream
- Meat-based Cuisines
- Pizza
- Other QSR Cuisines
- By Cuisine
- Cafe and Bars
- By Outlet
- Chained Outlets
- Independent Outlets
- By Locations
- Leisure
- Lodging
- Retail
- Standalone
- Travel
- By Service Type
- Dine-in
- Takeaway
- Delivery
List of Companies Covered in this Report:
- Golden Gate Group JSC
- Imex Pan Pacific Group
- Jollibee Foods Corporation
- Lotte GRS Co. Ltd.
- Mesa Group
- Restaurant Brands International
- Starbucks Corporation
- The Al Fresco's Group
- Yum! Brands Inc.
- Redsun ITI Corporation
- Viet Thai International JSC
- Trung Nguyen Legend Group
- Masan Group
- Tokyo Deli Vietnam JSC
- McDonald's Corporation
- Huy Vietnam
- Pizza 4P's Holdings
- KIDO Group
- Baemin Vietnam
- Highlands Coffee JSC
Additional Benefits:
- The market estimate (ME) sheet in Excel format
- 3 months of analyst support
TABLE OF CONTENTS
1 INTRODUCTION
- 1.1 Study Assumptions and Market Definition
- 1.2 Scope of the Study
2 RESEARCH METHODOLOGY
3 EXECUTIVE SUMMARY
4 MARKET LANDSCAPE
- 4.1 Market Overview
- 4.2 Market Drivers
- 4.2.1 Expansion and modernization of urban infrastructure
- 4.2.2 Rapid digitization and mobile app adoption for ordering
- 4.2.3 Rise of cloud kitchens and virtual-only brands
- 4.2.4 Increasing consumer preference for convenience and ready-to-eat food
- 4.2.5 Strong coffee and cafe culture
- 4.2.6 Expansion of quick-service and fast-casual restaurant chains
- 4.3 Market Restraints
- 4.3.1 Supply chain fragility and ingredient sourcing challenges
- 4.3.2 Pressure from multinational and domestic chains on smaller operators
- 4.3.3 Quality consistency issues and lack of standardized operating procedures among independents
- 4.3.4 Frequent policy/tax changes on food and beverage products
- 4.4 Industry Value Chain Analysis
- 4.5 Regulatory Landscape
- 4.6 Technological Outlook
- 4.7 Porter's Five Forces Analysis
- 4.7.1 Threat of New Entrants
- 4.7.2 Bargaining Power of Suppliers
- 4.7.3 Bargaining Power of Buyers
- 4.7.4 Threat of Substitutes
- 4.7.5 Competitive Rivalry
- 4.8 KEY INDUSTRY TRENDS
- 4.8.1 Number of Outlets
- 4.8.2 Average Order Value
5 MARKET SIZE AND GROWTH FORECASTS (VALUE)
- 5.1 By Foodservice Type
- 5.1.1 Cafe and Bars
- 5.1.1.1 By Cuisine
- 5.1.1.1.1 Bars and Pubs
- 5.1.1.1.2 Cafe
- 5.1.1.1.3 Juice/Smoothie/Desserts Bars
- 5.1.1.1.4 Specialist Coffee and Tea Shops
- 5.1.1.1 By Cuisine
- 5.1.2 Cloud Kitchen
- 5.1.3 Full Service Restaurants
- 5.1.3.1 By Cuisine
- 5.1.3.1.1 Asian
- 5.1.3.1.2 European
- 5.1.3.1.3 Latin American
- 5.1.3.1.4 Middle Eastern
- 5.1.3.1.5 North American
- 5.1.3.1.6 Other FSR Cuisines
- 5.1.3.1 By Cuisine
- 5.1.4 Quick Service Restaurants
- 5.1.4.1 By Cuisine
- 5.1.4.1.1 Bakeries
- 5.1.4.1.2 Burger
- 5.1.4.1.3 Ice Cream
- 5.1.4.1.4 Meat-based Cuisines
- 5.1.4.1.5 Pizza
- 5.1.4.1.6 Other QSR Cuisines
- 5.1.4.1 By Cuisine
- 5.1.1 Cafe and Bars
- 5.2 By Outlet
- 5.2.1 Chained Outlets
- 5.2.2 Independent Outlets
- 5.3 By Locations
- 5.3.1 Leisure
- 5.3.2 Lodging
- 5.3.3 Retail
- 5.3.4 Standalone
- 5.3.5 Travel
- 5.4 By Service Type
- 5.4.1 Dine-in
- 5.4.2 Takeaway
- 5.4.3 Delivery
6 COMPETITIVE LANDSCAPE
- 6.1 Market Concentration
- 6.2 Strategic Moves
- 6.3 Market Share Analysis
- 6.4 Company Profiles (includes Global level Overview, Market level overview, Core Segments, Financials as available, Strategic Information, Market Rank/Share for key companies, Products and Services, and Recent Developments)
- 6.4.1 Golden Gate Group JSC
- 6.4.2 Imex Pan Pacific Group
- 6.4.3 Jollibee Foods Corporation
- 6.4.4 Lotte GRS Co. Ltd.
- 6.4.5 Mesa Group
- 6.4.6 Restaurant Brands International
- 6.4.7 Starbucks Corporation
- 6.4.8 The Al Fresco's Group
- 6.4.9 Yum! Brands Inc.
- 6.4.10 Redsun ITI Corporation
- 6.4.11 Viet Thai International JSC
- 6.4.12 Trung Nguyen Legend Group
- 6.4.13 Masan Group
- 6.4.14 Tokyo Deli Vietnam JSC
- 6.4.15 McDonald's Corporation
- 6.4.16 Huy Vietnam
- 6.4.17 Pizza 4P's Holdings
- 6.4.18 KIDO Group
- 6.4.19 Baemin Vietnam
- 6.4.20 Highlands Coffee JSC
7 MARKET OPPORTUNITIES AND FUTURE OUTLOOK
- 7.1 White-Space and Unmet-Need Assessment

