PUBLISHER: Mordor Intelligence | PRODUCT CODE: 2187816

PUBLISHER: Mordor Intelligence | PRODUCT CODE: 2187816
Online Travel Agency - Market Share Analysis, Industry Trends & Statistics, Growth Forecasts (2027 - 2032)
According to Mordor Intelligence, the online travel agency market size is projected to expand from USD 561.3 billion in 2026 and USD 596.6 billion in 2027 to USD 803.7 billion by 2032, registering a CAGR of 6.14% between 2027 and 2032.
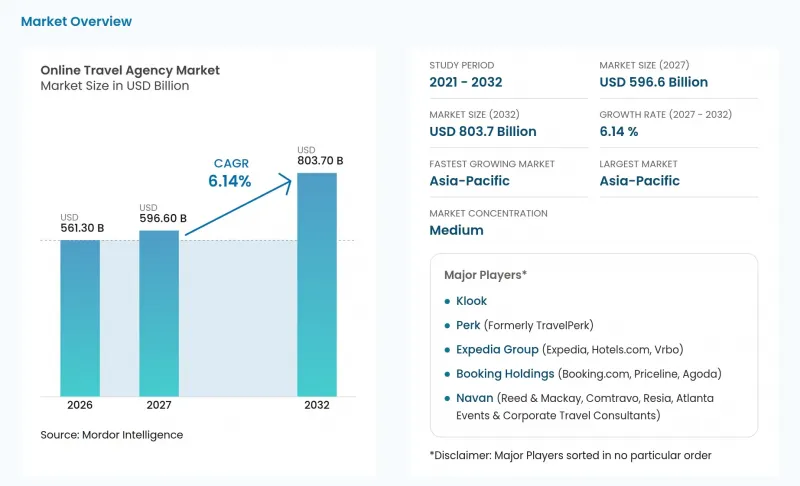
This report is segmented by Service Type (Transportation, Accommodation, Vacation Packages, and Others), Device (Mobile and Desktop), Traveler Type (Leisure Travelers and Business Travelers), and Geography (Asia-Pacific, Europe, North America, Middle East and Africa, and South America). The market forecasts are provided in terms of value (USD), based on availability.
Global Online Travel Agency Market Trends and Insights
Mobile-first booking and app adoption
Travel apps create an agency-controlled place to complete a reservation after the traveler has identified a trip. In India, app bookings accounted for 81.3% of MakeMyTrip's key-brand transactions in fiscal 2026, which ended March 31, 2026. The combined cumulative download count for MakeMyTrip, Goibibo, and redBus apps exceeded 566.7 million across iOS and Android by March 31, 2026. A downloaded app can provide a return booking route, giving the agency an opportunity to earn the next reservation through its own interface. That makes app adoption a distribution asset whose value can extend across later trip decisions, provided travelers continue choosing the agency's booking service.
International travel recovery and Asia-Pacific-led growth
Cross-border travel recovery enlarges the demand pool that agencies can serve through transport and accommodation reservations. Provisional UN Tourism figures put Asia and the Pacific's international tourist arrivals at 336.6 million in 2025, up 7.6% year over year against 4.7% worldwide. Regional arrivals grew 1% year over year in H1 2026 but were 11% below 2019 levels, as higher airfares, uncertainty, and air connectivity disrupted by the Middle East conflict since March 2026 affected demand. That combination supports further booking opportunities while making available connections and trip affordability important conditions for converting travel interest into transactions. Available routes and fares determine which parts of this recovering arrival pool an agency can feasibly serve.
Dependence on Google/AI search raises CAC volatility
Unpaid search exposure creates a cost risk even when an agency continues to attract travelers to its booking services. In its 2025 risk disclosure, Expedia Group warned that Google travel features and AI search threatened traffic and margins. It said replacement costs could rise if search providers continued their strategies or Expedia failed to manage paid and unpaid search effectively. The commercial constraint is the potential expense of preserving traffic when the source of those visits changes outside the agency's control. For exposed agencies, replacing an unpaid visit with a paid visit can consume more of the earnings available from that booking.
Other drivers and restraints analyzed in the detailed report include:
- Embedded fintech and BNPL lift conversion and AOV
- Airline NDC enables richer air retailing and ancillaries
- Regulatory scrutiny and rate-parity bans (European Union DMA)
For complete list of drivers and restraints, kindly check the Table Of Contents.
Segment Analysis
Transportation accounted for a 43.74% share of the online travel agency market size in 2026. Booking Holdings' platforms booked 68 million airline tickets in 2025, up 37% year over year, representing USD 16.8 billion in gross bookings. Booking Holdings' airline-ticket flows give an agency repeated opportunities to secure the principal transport reservation for travelers planning a specific journey.
Accommodation, including hotels and alternative accommodations, is forecast to be the fastest-growing segment at a 6.3% CAGR between 2027 and 2032. Expedia Group recorded 111.5 million booked hotel room and alternative accommodation property nights in Q2 2026. Booking.com listed more than 4.1 million alternative accommodation properties and more than 500,000 hotels, motels, and resorts on June 30, 2026. That combination of booking activity and varied supply gives accommodation intermediaries substantial scope to match different trip requirements. Reducing the search burden across hotel and alternative inventory can differentiate platforms serving travelers with the same destination and dates.
Complete Report Scope:
- By Service Type
- Accommodation (Hotels, Alternative Accommodations)
- Transportation
- Vacation Packages
- Others
- By Device
- Desktop
- Mobile
- By Traveler Type
- Leisure Travelers
- Business Travelers
- By Geography
- North America
- Canada
- United States
- Mexico
- South America
- Brazil
- Peru
- Chile
- Argentina
- Rest of South America
- Asia-Pacific
- India
- China
- Japan
- Australia
- South Korea
- South East Asia (Singapore, Malaysia, Thailand, Indonesia, Vietnam, and Philippines)
- Rest of Asia-Pacific
- Europe
- United Kingdom
- Germany
- France
- Spain
- Italy
- BENELUX (Belgium, Netherlands, and Luxembourg)
- NORDICS (Denmark, Finland, Iceland, Norway, and Sweden)
- Rest of Europe
- Middle East and Africa
- United Arab Emirates
- Saudi Arabia
- South Africa
- Nigeria
- Rest of Middle East and Africa
- North America
Geography Analysis
Asia-Pacific represented a 38.49% online travel agency market share in 2026 and is forecast to be the fastest-growing region, with a 6.65% CAGR between 2027 and 2032. The World Travel & Tourism Council (WTTC) estimated that the region's broader travel and tourism sector generated USD 3.29 trillion in GDP in 2025. The Pacific Asia Travel Association's June 2026 forecast projected international visitor arrivals across 39 Asia-Pacific destinations rising from 714.9 million in 2026 to 789.2 million in 2028. PATA forecast Vietnam to lead international visitor-arrival growth among the region's 10 largest destinations between 2025 and 2027. That projected expansion widens the potential audience for destination suppliers selling across regional borders through booking platforms.
North America was a substantial discovery base for Expedia Group, accounting for 75% of its global search volume in Q2 2026. During that quarter, US travelers' searches for Labor Day weekend travel on September 4 to 7, 2026, rose 35% year over year in the company's data. For Europe, Expedia Group characterized the wider Europe, Middle East, and Africa search region's shift toward near-term searches as consistent with European travelers planning last-minute summer trips. Poland, within Rest of Europe, recorded growth in 2025 guest nights in short-stay rentals booked through Airbnb, Booking, and Expedia. Seasonal US interest and European last-minute planning make offer timing a regional decision, while Poland's growth in platform-booked short-stay nights shows demand for rental-type stays rising within Rest of Europe.
South America's international tourist arrivals fell 2% in H1 2026 compared with H1 2025, with mixed destination results making the regional decline an inadequate guide to individual offers. For the Middle East and Africa, UN Tourism reported Middle Eastern arrivals down 22% amid conflict-related air traffic disruptions and lower traveler confidence, while African arrivals rose 4% over the same period. Those air traffic disruptions affected the Middle East and other regions from March 2026 and gradually eased after the ceasefire in May and early June, allowing some air routes to reopen. Saudi Arabia's Q2 2026 hotel occupancy exceeded the combined serviced-apartment and other-hospitality rate, although both declined year over year, making facility mix relevant to local accommodation offers.
- Booking Holdings (Booking.com, Priceline, Agoda)
- Navan (Reed & Mackay, Comtravo, Resia, Atlanta Events & Corporate Travel Consultants)
- Perk (Formerly TravelPerk)
- Expedia Group (Expedia, Hotels.com, Vrbo)
- Klook
- GetYourGuide
- Trip.com Group
- eDreams ODIGEO (eDreams, Opodo, GO Voyages)
- AsiaYo
- Secret Escapes
- TUI Musement
- Yatra
- MakeMyTrip
- Omio
- Despegar
- Traveloka
- lastminute.com
- On the Beach
- Hostelworld
- Universal Travels & Tourism LLC
- Hopper
- Webjet
- Rome2Rio
- Headout
Additional Benefits:
- The market estimate (ME) sheet in Excel format
- 3 months of analyst support
TABLE OF CONTENTS
1 INTRODUCTION
- 1.1 Study Assumptions and Market Definition
- 1.2 Scope of the Study
2 RESEARCH METHODOLOGY
3 EXECUTIVE SUMMARY
4 MARKET LANDSCAPE
- 4.1 Market Overview
- 4.2 Market Drivers
- 4.2.1 Mobile-first booking and app adoption
- 4.2.2 International travel recovery and Asia-Pacific-led growth
- 4.2.3 Embedded fintech and BNPL lift conversion and AOV
- 4.2.4 Airline NDC enables richer air retailing and ancillaries
- 4.2.5 Superapp and mini-program integrations expand OTA reach
- 4.2.6 AI-powered personalization and dynamic pricing optimization
- 4.3 Market Restraints
- 4.3.1 Dependence on Google/AI search raises CAC volatility
- 4.3.2 Regulatory scrutiny and rate-parity bans (European Union DMA)
- 4.3.3 NDC-driven content fragmentation and servicing complexity
- 4.3.4 Rising fraud/chargebacks in cross-border payments
- 4.4 Industry Value Chain Analysis
- 4.5 Regulatory Landscape
- 4.6 Technological Outlook
- 4.7 Porter's Five Forces Analysis
- 4.7.1 Threat of New Entrants
- 4.7.2 Bargaining Power of Suppliers
- 4.7.3 Bargaining Power of Buyers
- 4.7.4 Threat of Substitutes
- 4.7.5 Competitive Rivalry
5 MARKET SIZE AND GROWTH FORECASTS (VALUE)
- 5.1 By Service Type
- 5.1.1 Accommodation (Hotels, Alternative Accommodations)
- 5.1.2 Transportation
- 5.1.3 Vacation Packages
- 5.1.4 Others
- 5.2 By Device
- 5.2.1 Desktop
- 5.2.2 Mobile
- 5.3 By Traveler Type
- 5.3.1 Leisure Travelers
- 5.3.2 Business Travelers
- 5.4 By Geography
- 5.4.1 North America
- 5.4.1.1 Canada
- 5.4.1.2 United States
- 5.4.1.3 Mexico
- 5.4.2 South America
- 5.4.2.1 Brazil
- 5.4.2.2 Peru
- 5.4.2.3 Chile
- 5.4.2.4 Argentina
- 5.4.2.5 Rest of South America
- 5.4.3 Asia-Pacific
- 5.4.3.1 India
- 5.4.3.2 China
- 5.4.3.3 Japan
- 5.4.3.4 Australia
- 5.4.3.5 South Korea
- 5.4.3.6 South East Asia (Singapore, Malaysia, Thailand, Indonesia, Vietnam, and Philippines)
- 5.4.3.7 Rest of Asia-Pacific
- 5.4.4 Europe
- 5.4.4.1 United Kingdom
- 5.4.4.2 Germany
- 5.4.4.3 France
- 5.4.4.4 Spain
- 5.4.4.5 Italy
- 5.4.4.6 BENELUX (Belgium, Netherlands, and Luxembourg)
- 5.4.4.7 NORDICS (Denmark, Finland, Iceland, Norway, and Sweden)
- 5.4.4.8 Rest of Europe
- 5.4.5 Middle East and Africa
- 5.4.5.1 United Arab Emirates
- 5.4.5.2 Saudi Arabia
- 5.4.5.3 South Africa
- 5.4.5.4 Nigeria
- 5.4.5.5 Rest of Middle East and Africa
- 5.4.1 North America
6 COMPETITIVE LANDSCAPE
- 6.1 Market Concentration
- 6.2 Strategic Moves
- 6.3 Market Share Analysis
- 6.4 Company Profiles (includes Global level Overview, Market level overview, Core Segments, Financials as available, Strategic Information, Market Rank/Share for key companies, Products and Services, and Recent Developments)
- 6.4.1 Booking Holdings (Booking.com, Priceline, Agoda)
- 6.4.2 Navan (Reed & Mackay, Comtravo, Resia, Atlanta Events & Corporate Travel Consultants)
- 6.4.3 Perk (Formerly TravelPerk)
- 6.4.4 Expedia Group (Expedia, Hotels.com, Vrbo)
- 6.4.5 Klook
- 6.4.6 GetYourGuide
- 6.4.7 Trip.com Group
- 6.4.8 eDreams ODIGEO (eDreams, Opodo, GO Voyages)
- 6.4.9 AsiaYo
- 6.4.10 Secret Escapes
- 6.4.11 TUI Musement
- 6.4.12 Yatra
- 6.4.13 MakeMyTrip
- 6.4.14 Omio
- 6.4.15 Despegar
- 6.4.16 Traveloka
- 6.4.17 lastminute.com
- 6.4.18 On the Beach
- 6.4.19 Hostelworld
- 6.4.20 Universal Travels & Tourism LLC
- 6.4.21 Hopper
- 6.4.22 Webjet
- 6.4.23 Rome2Rio
- 6.4.24 Headout
7 MARKET OPPORTUNITIES AND FUTURE OUTLOOK
- 7.1 White-Space and Unmet-Need Assessment

