
Need help finding what you are looking for?
Contact Us
PUBLISHER: Mordor Intelligence | PRODUCT CODE: 1444830

PUBLISHER: Mordor Intelligence | PRODUCT CODE: 1444830
Dairy - Market Share Analysis, Industry Trends & Statistics, Growth Forecasts (2024 - 2029)
PUBLISHED:
PAGES: 513 Pages
DELIVERY TIME: 2-3 business days
SELECT AN OPTION
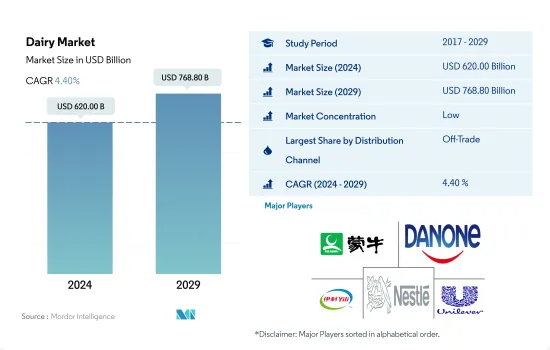
The Dairy Market size is estimated at USD 620 billion in 2024, and is expected to reach USD 768.80 billion by 2029, growing at a CAGR of 4.40% during the forecast period (2024-2029).
The capability to influence consumer decision is driving the demand through Supermarkets/ Hypermarkets.
- Compared to other retail channels, supermarkets and hypermarkets dominate the dairy market. Europe topped the place with the most sales of dairy products in Supermarkets and Hypermarkets. As of 2022, the sales of dairy products through supermarkets and hypermarkets accounted for 41.6% of the value share in Europe. The proximity factor of Supermarkets and Hypermarkets, especially in large cities and metropolitan areas, provides them with an added advantage of influencing the consumer's decision to make the purchase among the large variety of products available in the market.
- Increasing demand for dairy-based recipes from food service channels is boosting the growth of the global dairy market. The sales of dairy through on-trade channels are anticipated to grow by 9% in 2025 compared to the year 2022. The segment's growth is attributed to consuming food prepared away from home. In 2022, 47% of consumers globally consumed meals at restaurants, and 31% of consumers ordered their food from food service channels.
- Asia-Pacific is one of the largest markets for the sales of dairy products through online channels globally, growing by 10.2% in terms of value from 2018 to 2022. Advantages like free deliveries, ease of canceling orders, refund process, and coupon codes offered by these platforms provide consumers with a hassle-free shopping experience.
- Among all dairy products, dairy desserts accounted for the majority of share in off-trade channels. In 2022, dairy desserts accounted for 40.24% of the total dairy industry, followed by cheese, with a 24.6% value share.
The demand from Europe followed by Asia-Pacific is dominating the global market
- The global dairy market grew by 11% in terms of value from 2019 to 2023. South America is expected to see a substantial spike of 12% in dairy consumption in 2023 compared to 2019, mainly due to government investments, product innovations from manufacturers, and the growing awareness of healthier choices.
- Europe dominates the market with a value share of 33.76%, which was 10.9% more than North America in 2023. High production of cow's milk and the growing government investments in the milk industry are driving the market's growth in Europe. Much of the dairy consumed in Europe is produced locally. In 2021, European dairy farms produced 161 million metric tons of raw milk, of which 96% was cow's milk. The European governments' investments in organic farming are creating opportunities for organic milk production. The European Commission's Green Deal Industry Plan set a target of utilizing at least 25% of the European Union's agricultural land under organic farming by 2030.
- Asia-Pacific is the second-largest dairy market globally. The region is anticipated to register a growth rate of 14% by value during 2024-2027. In Asia-Pacific, the dairy market is expanding rigorously due to the strong demand for dairy products and the presence of countries with the world's leading dairy producers. India is the largest producer of milk in the world, contributing 24% of the global milk production from 2021-2022. The Government of India permitted 100% FDI (Foreign Direct Investment) through an automatic route for food processing. The dairy industry recorded a substantial FDI constituting about 40% of FDIs in the Indian food industry, thus boosting the market's growth in the region.
Global Dairy Market Trends
The consumption of milk and milk-related products is driven by increasing health-consciousness, awareness of nutritional benefits, and preference for organic and natural products.
- Consumption of milk and milk-related products is growing due to health-conscious consumers, along with awareness of the nutritional benefits of different dairy products. In 2022, the per capita consumption of the European dairy industry observed a growth rate of 1.35% compared to 2021. Consumers in developed countries like the United States, Germany, and the United Kingdom have gradually become more interested in consuming milk and other dairy products produced organically or using other natural techniques as they believe them to be more natural and healthy.
- Dairy products play a vital part in the diets of Americans as they use cheese, dairy desserts, and butter significantly in different food items like pizza, pasta, and burger. This has led to increased demand for different dairy products across the region. Owing to high domestic consumption, there is significant growth in terms of the production and import of dairy products. In 2021, the United States imported USD 3.3 billion worth of dairy products. Production of cheese also increased by 2.8% to 13.6 billion pounds in 2021.
- Strong growth is projected for free-from dairy products, including yogurt, in developed countries like the United States, Australia, the United Kingdom, and Germany. Products with low sugar content, high protein or fiber, and zero or minimally processed sugar are increasingly desired by consumers. Owing to the growing per capita consumption of yogurt, production has also witnessed significant growth. For example, the production volume of yogurt was approximately 463,000 tonnes in the United Kingdom in 2021.
Dairy Industry Overview
The Dairy Market is fragmented, with the top five companies occupying 9.58%. The major players in this market are China Mengniu Dairy Company Ltd, Danone SA, Inner Mongolia Yili Industrial Group Co. Ltd, Nestle SA and Unilever PLC (sorted alphabetically).
Additional Benefits:
- The market estimate (ME) sheet in Excel format
- 3 months of analyst support
Product Code: 60119
TABLE OF CONTENTS
1 EXECUTIVE SUMMARY & KEY FINDINGS
2 REPORT OFFERS
3 INTRODUCTION
- 3.1 Study Assumptions & Market Definition
- 3.2 Scope of the Study
- 3.3 Research Methodology
4 KEY INDUSTRY TRENDS
- 4.1 Per Capita Consumption
- 4.2 Raw Material/Commodity Production
- 4.2.1 Butter
- 4.2.2 Cheese
- 4.2.3 Milk
- 4.3 Regulatory Framework
- 4.3.1 Argentina
- 4.3.2 Australia
- 4.3.3 Brazil
- 4.3.4 Canada
- 4.3.5 China
- 4.3.6 France
- 4.3.7 Germany
- 4.3.8 India
- 4.3.9 Italy
- 4.3.10 Japan
- 4.3.11 Mexico
- 4.3.12 Saudi Arabia
- 4.3.13 United Arab Emirates
- 4.3.14 United Kingdom
- 4.3.15 United States
- 4.4 Value Chain & Distribution Channel Analysis
5 MARKET SEGMENTATION (includes market size in Value in USD and Volume, Forecasts up to 2029 and analysis of growth prospects)
- 5.1 Category
- 5.1.1 Butter
- 5.1.1.1 By Product Type
- 5.1.1.1.1 Cultured Butter
- 5.1.1.1.2 Uncultured Butter
- 5.1.2 Cheese
- 5.1.2.1 By Product Type
- 5.1.2.1.1 Natural Cheese
- 5.1.2.1.2 Processed Cheese
- 5.1.3 Cream
- 5.1.3.1 By Product Type
- 5.1.3.1.1 Double Cream
- 5.1.3.1.2 Single Cream
- 5.1.3.1.3 Whipping Cream
- 5.1.3.1.4 Others
- 5.1.4 Dairy Desserts
- 5.1.4.1 By Product Type
- 5.1.4.1.1 Cheesecakes
- 5.1.4.1.2 Frozen Desserts
- 5.1.4.1.3 Ice Cream
- 5.1.4.1.4 Mousses
- 5.1.4.1.5 Others
- 5.1.5 Milk
- 5.1.5.1 By Product Type
- 5.1.5.1.1 Condensed milk
- 5.1.5.1.2 Flavored Milk
- 5.1.5.1.3 Fresh Milk
- 5.1.5.1.4 Powdered Milk
- 5.1.5.1.5 UHT Milk
- 5.1.6 Sour Milk Drinks
- 5.1.7 Yogurt
- 5.1.7.1 By Product Type
- 5.1.7.1.1 Flavored Yogurt
- 5.1.7.1.2 Unflavored Yogurt
- 5.1.1 Butter
- 5.2 Distribution Channel
- 5.2.1 Off-Trade
- 5.2.1.1 Convenience Stores
- 5.2.1.2 Online Retail
- 5.2.1.3 Specialist Retailers
- 5.2.1.4 Supermarkets and Hypermarkets
- 5.2.1.5 Others (Warehouse clubs, gas stations, etc.)
- 5.2.2 On-Trade
- 5.2.1 Off-Trade
- 5.3 Region
- 5.3.1 Africa
- 5.3.1.1 By Category
- 5.3.1.2 By Distribution Channel
- 5.3.1.3 By Country
- 5.3.1.3.1 Egypt
- 5.3.1.3.2 Nigeria
- 5.3.1.3.3 South Africa
- 5.3.1.3.4 Rest of Africa
- 5.3.2 Asia-Pacific
- 5.3.2.1 By Category
- 5.3.2.2 By Distribution Channel
- 5.3.2.3 By Country
- 5.3.2.3.1 Australia
- 5.3.2.3.2 China
- 5.3.2.3.3 India
- 5.3.2.3.4 Indonesia
- 5.3.2.3.5 Japan
- 5.3.2.3.6 Malaysia
- 5.3.2.3.7 New Zealand
- 5.3.2.3.8 Pakistan
- 5.3.2.3.9 South Korea
- 5.3.2.3.10 Rest of Asia Pacific
- 5.3.3 Europe
- 5.3.3.1 By Category
- 5.3.3.2 By Distribution Channel
- 5.3.3.3 By Country
- 5.3.3.3.1 Belgium
- 5.3.3.3.2 France
- 5.3.3.3.3 Germany
- 5.3.3.3.4 Italy
- 5.3.3.3.5 Netherlands
- 5.3.3.3.6 Russia
- 5.3.3.3.7 Spain
- 5.3.3.3.8 Turkey
- 5.3.3.3.9 United Kingdom
- 5.3.3.3.10 Rest of Europe
- 5.3.4 Middle East
- 5.3.4.1 By Category
- 5.3.4.2 By Distribution Channel
- 5.3.4.3 By Country
- 5.3.4.3.1 Bahrain
- 5.3.4.3.2 Iran
- 5.3.4.3.3 Kuwait
- 5.3.4.3.4 Oman
- 5.3.4.3.5 Qatar
- 5.3.4.3.6 Saudi Arabia
- 5.3.4.3.7 United Arab Emirates
- 5.3.4.3.8 Rest of Middle East
- 5.3.5 North America
- 5.3.5.1 By Category
- 5.3.5.2 By Distribution Channel
- 5.3.5.3 By Country
- 5.3.5.3.1 Canada
- 5.3.5.3.2 Mexico
- 5.3.5.3.3 United States
- 5.3.5.3.4 Rest of North America
- 5.3.6 South America
- 5.3.6.1 By Category
- 5.3.6.2 By Distribution Channel
- 5.3.6.3 By Country
- 5.3.6.3.1 Argentina
- 5.3.6.3.2 Brazil
- 5.3.6.3.3 Rest of South America
- 5.3.1 Africa
6 COMPETITIVE LANDSCAPE
- 6.1 Key Strategic Moves
- 6.2 Market Share Analysis
- 6.3 Company Landscape
- 6.4 Company Profiles (includes Global Level Overview, Market Level Overview, Core Business Segments, Financials, Headcount, Key Information, Market Rank, Market Share, Products and Services, and Analysis of Recent Developments).
- 6.4.1 Almarai Company
- 6.4.2 Arla Foods Amba
- 6.4.3 China Mengniu Dairy Company Ltd
- 6.4.4 Dairy Farmers of America Inc.
- 6.4.5 Danone SA
- 6.4.6 Fonterra Co-operative Group Limited
- 6.4.7 Groupe Lactalis
- 6.4.8 Gujarat Co-operative Milk Marketing Federation Ltd
- 6.4.9 Inner Mongolia Yili Industrial Group Co. Ltd
- 6.4.10 Nestle SA
- 6.4.11 Saputo Inc.
- 6.4.12 Unilever PLC
7 KEY STRATEGIC QUESTIONS FOR DAIRY AND DAIRY ALTERNATIVE CEOS
8 APPENDIX
- 8.1 Global Overview
- 8.1.1 Overview
- 8.1.2 Porter's Five Forces Framework
- 8.1.3 Global Value Chain Analysis
- 8.1.4 Market Dynamics (DROs)
- 8.2 Sources & References
- 8.3 List of Tables & Figures
- 8.4 Primary Insights
- 8.5 Data Pack
- 8.6 Glossary of Terms
Have a question?


SELECT AN OPTION
Have a question?
Questions? Please give us a call or visit the contact form.