
Need help finding what you are looking for?
Contact Us
PUBLISHER: Mordor Intelligence | PRODUCT CODE: 1687353

PUBLISHER: Mordor Intelligence | PRODUCT CODE: 1687353
Asia-Pacific Dairy - Market Share Analysis, Industry Trends & Statistics, Growth Forecasts (2025 - 2030)
PUBLISHED:
PAGES: 301 Pages
DELIVERY TIME: 2-3 business days
SELECT AN OPTION
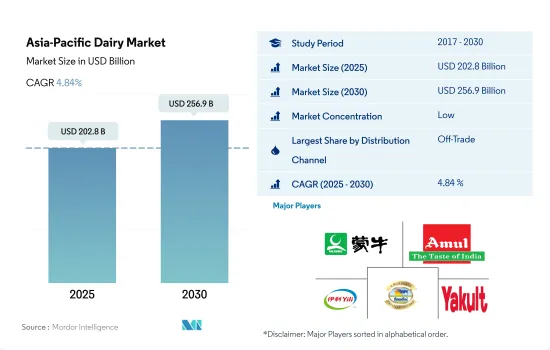
The Asia-Pacific Dairy Market size is estimated at 202.8 billion USD in 2025, and is expected to reach 256.9 billion USD by 2030, growing at a CAGR of 4.84% during the forecast period (2025-2030).
Widespread adoption of distribution channels, led by remarkable sales through supermarkets and hypermarkets is propelling the growth
- Among overall distribution channels, the Asia-Pacific dairy market is dominated by the off-trade segment. Supermarkets and hypermarkets accounted for most of the share in the off-trade segment. In 2022, supermarkets and hypermarkets accounted for 57.9% of the value share. The major reason behind the segment holding the highest share is the strong penetration of popular chains such as Maruetsu, Aldi, Big Bazaar, Woolworths Group, and Aeon Retail, which provide a wide selection of dairy products that are both imported and made locally.
- There is an increasing demand for dairy-based recipes from foodservice channels, further boosting the market growth. Dairy sales in the on-trade channel are anticipated to grow by USD 17,104.2 million in 2025, up from USD 14,932.6 million in 2021. The growth in the segment is attributed to consuming food prepared away from home, whether while eating out at a restaurant or ordering takeout. As of 2021, Indian consumers were eating out nearly seven times a month, and over 80% of the respondents stated that they preferred affordable casual dining options and quick-service restaurants to eat out, while cafes, desserts, and ice-cream parlors were the most frequented.
- When it comes to online shopping, the Asia-Pacific region is one of the largest markets in the world. Thus, online retail stores as a sales channel are gaining popularity across the region. In 2022, the sales value of dairy products through e-commerce in the Asia-Pacific region reached a total of USD 6028.7 million, while it was USD 5618.3 million in 2021.
- Among all dairy products, milk accounted for the majority of share in overall retail channels. In 2022, milk accounted for 55% of the total category, and yogurt stood in second place with 29.2% of the value share.
High production of raw milk and rising consumer preference for quality dairy products are key market drivers in the region
- India and China are identified as the region's major markets for the dairy industry, followed by New Zealand and Japan. India and China collectively accounted for a 65.25% share of the overall dairy products volume sales across the region in 2022. The key driving factors are the high production of raw milk, rising consumer preference for quality dairy products, and adequate industry regulation to facilitate the manufacturing and trading of dairy products. The Government of India has permitted 100% FDI (Foreign Direct Investment) through an automatic route for food processing. The dairy industry accounts for a substantial FDI contribution of about 40% of the total FDIs in the Indian food sector. Also, India is one of the largest milk-producing countries, contributing 24% of global milk production in 2021.
- Milk and yogurt are the leading categories in the Japanese dairy market and collectively accounted for an 83.18% share of the overall dairy sales in 2022. The market growth in the country is attributed to the advancement of dairy farms. In Japan, dairy farms with 200 or more cows increased by 10% in 2022. Also, the average yard population of Japanese dairy farms reached 103 heads, a 5% Y-o-Y growth from 2021 to 2022. China is identified as the fastest-growing dairy market in Asia-Pacific. In China, dairy products' sales value is anticipated to register a CAGR of 9.21% during the forecast period to reach a market value of USD 123,925.48 million by the end of 2029.
- Demand for healthy dairy variants such as no or reduced sugar, low-fat content, grass-fed, and organic products is anticipated to drive market growth in the region during the forecast period. Aquila Sustainable Farming Ltd (ASF), a supplier of certified A2 organic milk in New Zealand, converted four of its six portfolio farms to A2 organic in 2020.
Asia-Pacific Dairy Market Trends
Increasing consumer spending on healthy foods and beverages, along with the nutritional benefits associated with dairy products, is driving the growing demand for milk and milk products in developing countries like Japan, India, and Australia
- Demand for milk and milk products in developing countries is growing with increasing consumer spending on healthy food and beverage products and rising awareness of the nutritional benefits associated with consuming different types of dairy products. For example, fresh milk in Japan is expected to become popular over the coming decades in line with growth in the Japanese dairy farming industry owing to the increased import of dairy products. In 2021, Japan's annual per capita expenditure on milk products amounted to around USD 39 on average.
- With the growing adoption of Western culture and changing food habits, the demand for cheese has increased in India. There is strong demand from the fast-food industry as well, with foreign foodservice operators strategically expanding their presence. In 2021, India had 14,095 Domino's Pizza outlets, which had grown from 830 in 2014.
- Yogurt is referred to as curd in India. There is a high consumption of plain yogurt as it is typically consumed as part of a meal or refreshment by the Indian population in their daily routine. The per capita yogurt consumption in India increased by 5.2% in 2023-2024, whereas in Australia, it rose by 1.2% over the same period. The ice cream market in Asia is growing, with brands tapping into growing trends revolving around indulgence and a health perspective. For example, per capita consumption of ice cream in India grew by 5.90% in 2023-2024. Rising consumer expenditure in the food and beverage industry, the introduction of new flavors, increasing impulse purchasing, and strong demand for healthy ice cream products among consumers are some of the primary factors driving the consumption of ice cream.
Asia-Pacific Dairy Industry Overview
The Asia-Pacific Dairy Market is fragmented, with the top five companies occupying 22.28%. The major players in this market are China Mengniu Dairy Company Ltd, Gujarat Co-operative Milk Marketing Federation Ltd, Inner Mongolia Yili Industrial Group Co. Ltd, Karnataka Cooperative Milk Producers Federation Ltd and Yakult Honsha Co. Ltd (sorted alphabetically).
Additional Benefits:
- The market estimate (ME) sheet in Excel format
- 3 months of analyst support
Product Code: 61549
TABLE OF CONTENTS
1 EXECUTIVE SUMMARY & KEY FINDINGS
2 REPORT OFFERS
3 INTRODUCTION
- 3.1 Study Assumptions & Market Definition
- 3.2 Scope of the Study
- 3.3 Research Methodology
4 KEY INDUSTRY TRENDS
- 4.1 Per Capita Consumption
- 4.2 Raw Material/commodity Production
- 4.2.1 Butter
- 4.2.2 Cheese
- 4.2.3 Milk
- 4.3 Regulatory Framework
- 4.3.1 Australia
- 4.3.2 China
- 4.3.3 India
- 4.3.4 Japan
- 4.4 Value Chain & Distribution Channel Analysis
5 MARKET SEGMENTATION (includes market size in Value in USD and Volume, Forecasts up to 2030 and analysis of growth prospects)
- 5.1 Category
- 5.1.1 Butter
- 5.1.1.1 By Product Type
- 5.1.1.1.1 Cultured Butter
- 5.1.1.1.2 Uncultured Butter
- 5.1.2 Cheese
- 5.1.2.1 By Product Type
- 5.1.2.1.1 Natural Cheese
- 5.1.2.1.2 Processed Cheese
- 5.1.3 Cream
- 5.1.3.1 By Product Type
- 5.1.3.1.1 Double Cream
- 5.1.3.1.2 Single Cream
- 5.1.3.1.3 Whipping Cream
- 5.1.3.1.4 Others
- 5.1.4 Dairy Desserts
- 5.1.4.1 By Product Type
- 5.1.4.1.1 Cheesecakes
- 5.1.4.1.2 Frozen Desserts
- 5.1.4.1.3 Ice Cream
- 5.1.4.1.4 Mousses
- 5.1.4.1.5 Others
- 5.1.5 Milk
- 5.1.5.1 By Product Type
- 5.1.5.1.1 Condensed milk
- 5.1.5.1.2 Flavored Milk
- 5.1.5.1.3 Fresh Milk
- 5.1.5.1.4 Powdered Milk
- 5.1.5.1.5 UHT Milk
- 5.1.6 Sour Milk Drinks
- 5.1.7 Yogurt
- 5.1.7.1 By Product Type
- 5.1.7.1.1 Flavored Yogurt
- 5.1.7.1.2 Unflavored Yogurt
- 5.1.1 Butter
- 5.2 Distribution Channel
- 5.2.1 Off-Trade
- 5.2.1.1 Convenience Stores
- 5.2.1.2 Online Retail
- 5.2.1.3 Specialist Retailers
- 5.2.1.4 Supermarkets and Hypermarkets
- 5.2.1.5 Others (Warehouse clubs, gas stations, etc.)
- 5.2.2 On-Trade
- 5.2.1 Off-Trade
- 5.3 Country
- 5.3.1 Australia
- 5.3.2 China
- 5.3.3 India
- 5.3.4 Indonesia
- 5.3.5 Japan
- 5.3.6 Malaysia
- 5.3.7 New Zealand
- 5.3.8 Pakistan
- 5.3.9 South Korea
- 5.3.10 Rest of Asia Pacific
6 COMPETITIVE LANDSCAPE
- 6.1 Key Strategic Moves
- 6.2 Market Share Analysis
- 6.3 Company Landscape
- 6.4 Company Profiles (includes Global Level Overview, Market Level Overview, Core Business Segments, Financials, Headcount, Key Information, Market Rank, Market Share, Products and Services, and Analysis of Recent Developments).
- 6.4.1 China Mengniu Dairy Company Ltd
- 6.4.2 Dodla Dairy Ltd
- 6.4.3 Fonterra Co-operative Group Limited
- 6.4.4 Gujarat Co-operative Milk Marketing Federation Ltd
- 6.4.5 Hatsun Agro Product Ltd
- 6.4.6 Inner Mongolia Yili Industrial Group Co. Ltd
- 6.4.7 Karnataka Cooperative Milk Producers Federation Ltd
- 6.4.8 Meiji Dairies Corporation
- 6.4.9 Nestle SA
- 6.4.10 Yakult Honsha Co. Ltd
7 KEY STRATEGIC QUESTIONS FOR DAIRY AND DAIRY ALTERNATIVE CEOS
8 APPENDIX
- 8.1 Global Overview
- 8.1.1 Overview
- 8.1.2 Porter's Five Forces Framework
- 8.1.3 Global Value Chain Analysis
- 8.1.4 Market Dynamics (DROs)
- 8.2 Sources & References
- 8.3 List of Tables & Figures
- 8.4 Primary Insights
- 8.5 Data Pack
- 8.6 Glossary of Terms
Have a question?


SELECT AN OPTION
Have a question?
Questions? Please give us a call or visit the contact form.