
PUBLISHER: Global Market Insights Inc. | PRODUCT CODE: 1801915

PUBLISHER: Global Market Insights Inc. | PRODUCT CODE: 1801915
Marine Protein Hydrolysate Market Opportunity, Growth Drivers, Industry Trend Analysis, and Forecast 2025 - 2034
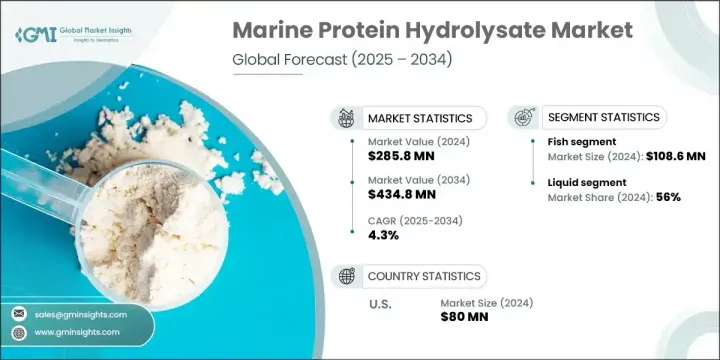
The Global Marine Protein Hydrolysate Market was valued at USD 285.8 million in 2024 and is estimated to grow at a CAGR of 4.3% to reach USD 434.8 million by 2034. This growth is being driven by rising demand across food and beverage, aquafeed, nutraceutical, and pharmaceutical sectors. As the focus on clean-label ingredients and sustainable sourcing intensifies, marine protein hydrolysates are gaining popularity for their functional and nutritional benefits. Their use as a natural additive is increasing, especially in regions with strict ingredient regulations, such as Europe. Ongoing advancements in processing technologies and expanding health-conscious consumer bases globally are fueling innovation and market expansion. Additionally, the transition toward sustainable raw materials and the need for eco-friendly production solutions support market growth, especially in health-driven economies.
Despite this progress, the industry remains challenged by supply-side issues. Marine protein hydrolysates heavily depend on fish, crustaceans, and algae as base materials. Environmental changes, overfishing, and regulatory limits often disrupt availability and lead to cost fluctuations. These factors contribute to instability in production and pricing, affecting the overall supply chain and posing a potential barrier to consistent growth in the market.
| Market Scope | |
|---|---|
| Start Year | 2024 |
| Forecast Year | 2025-2034 |
| Start Value | $285.8 Million |
| Forecast Value | $434.8 Million |
| CAGR | 4.3% |
The fish segment generated USD 108.6 million in 2024 backed by its rich protein profile, digestibility, and compatibility with animal feed, supplements, and functional foods. The established sourcing and processing infrastructure make fish-based hydrolysates a preferred option in both animal nutrition and dietary sectors. Crustaceans are also significant due to their concentration of bioactive compounds and their growing role in cost-efficient, waste-reducing hydrolysate production. These variants are increasingly utilized in aquaculture and nutraceuticals due to their nutritional advantages.
The liquid formulations segment held 56% share in 2024. Their superior solubility and easy application make them particularly suitable for aquaculture feeds and liquid dietary supplements. Liquids blend effortlessly with other formulations, improving feed conversion and nutrient absorption, especially in aquatic environments. These properties make liquid marine protein hydrolysates highly attractive in both nutraceutical and functional beverage industries.
U.S. Marine Protein Hydrolysate Market was valued at USD 80 million in 2024. The region's emphasis on advanced health products and strong food and supplement manufacturing infrastructure continues to boost demand. With increasing attention to clean-label nutrition and sustainability, marine-based ingredients are being incorporated more frequently into sports nutrition, functional foods, and wellness formulations. Innovation and adherence to high regulatory standards drive the market's upward trajectory across U.S.-based industries.
Key players operating in the Global Marine Protein Hydrolysate Market include Copalis, Hofseth BioCare, Aker BioMarine, SAMPI, Scanbio, Bio-Marine Ingredients, Socropole, Marutham Bio Ages Innovations, and Symrise. To strengthen their market presence, companies in the marine protein hydrolysate space are focusing on expanding raw material sourcing networks to reduce dependency on volatile marine ecosystems. Strategic investments in processing technologies are helping improve yield, purity, and product consistency. Brands are also tailoring formulations for specific end-use industries such as aquafeed, sports nutrition, and clinical nutrition. Collaborations with research institutions allow players to stay ahead in developing bioactive compounds with proven functional benefits. To tap into growing health-conscious consumer segments, businesses are marketing clean-label and traceable supply chain claims.
Table of Contents
Chapter 1 Methodology & Scope
- 1.1 Market scope and definition
- 1.2 Research design
- 1.2.1 Research approach
- 1.2.2 Data collection methods
- 1.3 Data mining sources
- 1.3.1 Global
- 1.3.2 Regional/Country
- 1.4 Base estimates and calculations
- 1.4.1 Base year calculation
- 1.4.2 Key trends for market estimation
- 1.5 Primary research and validation
- 1.5.1 Primary sources
- 1.6 Forecast model
- 1.7 Research assumptions and limitations
Chapter 2 Executive Summary
- 2.1 Industry 360° synopsis
- 2.2 Key market trends
- 2.2.1 Source trends
- 2.2.2 Form trends
- 2.2.3 Application trends
- 2.2.4 Regional trends
- 2.3 TAM Analysis, 2025-2034
- 2.4 CXO perspectives: Strategic imperatives
- 2.4.1 Executive decision points
- 2.4.2 Critical success factors
- 2.5 Future Outlook and Strategic Recommendations
Chapter 3 Industry Insights
- 3.1 Industry ecosystem analysis
- 3.1.1 Supplier landscape
- 3.1.2 Profit margin
- 3.1.3 Value addition at each stage
- 3.1.4 Factor affecting the value chain
- 3.1.5 Disruptions
- 3.2 Industry impact forces
- 3.2.1 Growth drivers
- 3.2.2 Industry pitfalls and challenges
- 3.2.3 Market opportunities
- 3.3 Growth potential analysis
- 3.4 Regulatory landscape
- 3.4.1 North America
- 3.4.2 Europe
- 3.4.3 Asia Pacific
- 3.4.4 Latin America
- 3.4.5 Middle East & Africa
- 3.5 Porter’s analysis
- 3.6 PESTEL analysis
- 3.7 Technology and Innovation landscape
- 3.7.1 Current technological trends
- 3.7.2 Emerging technologies
- 3.8 Price trends
- 3.8.1 By region
- 3.8.2 By Source
- 3.9 Future market trends
- 3.10 Technology and Innovation landscape
- 3.10.1 Current technological trends
- 3.10.2 Emerging technologies
- 3.11 Patent Landscape
- 3.12 Trade statistics (HS code) (Note: the trade statistics will be provided for key countries only)
- 3.12.1 Major importing countries
- 3.12.2 Major exporting countries
- 3.13 Sustainability and environmental aspects
- 3.13.1 Sustainable practices
- 3.13.2 Waste reduction strategies
- 3.13.3 Energy efficiency in production
- 3.13.4 Eco-friendly initiatives
- 3.14 Carbon footprint consideration
Chapter 4 Competitive Landscape, 2024
- 4.1 Introduction
- 4.2 Company market share analysis
- 4.2.1 By region
- 4.2.1.1 North America
- 4.2.1.2 Europe
- 4.2.1.3 Asia Pacific
- 4.2.1.4 LATAM
- 4.2.1.5 MEA
- 4.2.1 By region
- 4.3 Company matrix analysis
- 4.4 Competitive analysis of major market players
- 4.5 Competitive positioning matrix
- 4.6 Key developments
- 4.6.1 Mergers & acquisitions
- 4.6.2 Partnerships & collaborations
- 4.6.3 New product launches
- 4.6.4 Expansion plans
Chapter 5 Market Estimates and Forecast, By Source, 2021-2034 (USD Million) (Kilo Tons)
- 5.1 Key trends
- 5.2 Fish
- 5.3 Crustaceans
- 5.4 Algae
Chapter 6 Market Estimates and Forecast, By Form, 2021-2034 (USD Million) (Kilo Tons)
- 6.1 Key trends
- 6.2 Liquid
- 6.3 Powder
Chapter 7 Market Estimates and Forecast, By Application, 2021-2034 (USD Million) (Kilo Tons)
- 7.1 Key trends
- 7.2 Food and beverages
- 7.3 Animal feed
- 7.4 Pharmaceuticals
- 7.5 Others
Chapter 8 Market Estimates and Forecast, By Region, 2021-2034 (USD Million) (Kilo Tons)
- 8.1 Key trends
- 8.2 North America
- 8.2.1 U.S.
- 8.2.2 Canada
- 8.3 Europe
- 8.3.1 Germany
- 8.3.2 UK
- 8.3.3 France
- 8.3.4 Spain
- 8.3.5 Italy
- 8.3.6 Rest of Europe
- 8.4 Asia Pacific
- 8.4.1 China
- 8.4.2 India
- 8.4.3 Japan
- 8.4.4 Australia
- 8.4.5 South Korea
- 8.4.6 Rest of Asia Pacific
- 8.5 Latin America
- 8.5.1 Brazil
- 8.5.2 Mexico
- 8.5.3 Argentina
- 8.5.4 Rest of Latin America
- 8.6 Middle East and Africa
- 8.6.1 Saudi Arabia
- 8.6.2 South Africa
- 8.6.3 UAE
- 8.6.4 Rest of Middle East and Africa
Chapter 9 Company Profiles
- 9.1 Copalis
- 9.2 Symrise
- 9.3 Hofseth BioCare
- 9.4 Scanbio
- 9.5 Socropole
- 9.6 Bio-Marine Ingredients
- 9.7 Aker BioMarine
- 9.8 Marutham Bio Ages Innovations
- 9.9 SAMPI

