
PUBLISHER: Global Market Insights Inc. | PRODUCT CODE: 1885813

PUBLISHER: Global Market Insights Inc. | PRODUCT CODE: 1885813
Renal Diet Protein Hydrolysates Market Opportunity, Growth Drivers, Industry Trend Analysis, and Forecast 2025 - 2034
The Global Renal Diet Protein Hydrolysates Market was valued at USD 7.2 billion in 2024 and is estimated to grow at a CAGR of 7.5% to reach USD 14.9 billion by 2034.
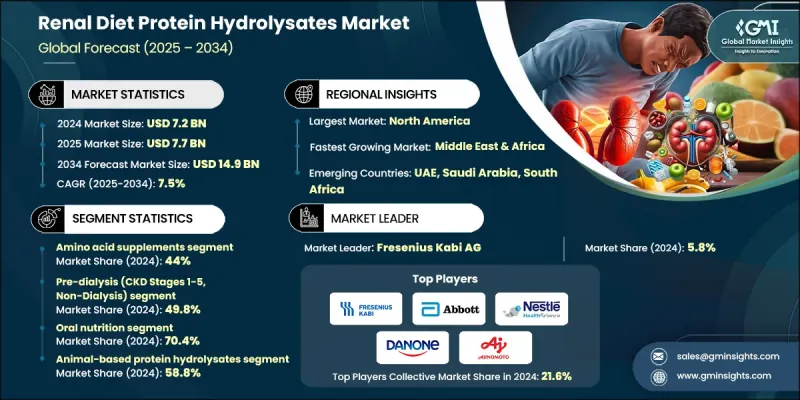
This growth is driven by the increasing global burden of chronic kidney disease and rising awareness of the importance of specialized nutrition in kidney care. Healthcare systems are placing greater emphasis on protein management to support kidney function, pushing demand for hydrolyzed protein solutions that are easier to process and deliver essential nutrients with reduced strain on the kidneys. An aging global population has also contributed significantly, as age-related kidney conditions become more widespread. Research continues to highlight the clinical benefits of protein hydrolysates in providing targeted nutrition for kidney-impaired individuals. With early detection and personalized dietary interventions gaining traction, demand for these specialized formulations is expected to intensify. Improvements in enzymatic hydrolysis technologies have enhanced product consistency and production efficiency, increasing availability worldwide. Rising healthcare expenditures and the need for cost-effective nutritional therapies to help slow disease progression further reinforce the market's long-term outlook.
| Market Scope | |
|---|---|
| Start Year | 2024 |
| Forecast Year | 2025-2034 |
| Start Value | $7.2 Billion |
| Forecast Value | $14.9 Billion |
| CAGR | 7.5% |
The amino acid supplements segment held a 44% share in 2024 and is projected to grow at a CAGR of 7.5% through 2034. These supplements play a key role in meeting nutrient requirements for individuals with chronic kidney disease while minimizing the complications associated with intact protein intake. Tailored amino acid formulations are essential for patients following protein-limited diets, and ongoing progress in formulation science is expected to support better absorption and precise nutrient delivery.
The pre-dialysis category, covering CKD Stages 1-5 (non-dialysis), accounted for a 49.8% share in 2024 and is anticipated to grow at a CAGR of 7.4% from 2025 to 2034. This segment is the largest due to the substantial number of patients who require early nutritional intervention before reaching dialysis. As guidelines continue to emphasize controlled protein intake to slow kidney deterioration, demand for specialized hydrolysate-based products is expected to remain strong.
North America Renal Diet Protein Hydrolysates Market held a 35.3% share in 2024. The region benefits from advanced healthcare systems, established reimbursement structures, and a high incidence of chronic kidney disease. Widespread adoption of medical nutrition products and strong clinical frameworks for dietary management contribute significantly to regional leadership.
Key companies in the Renal Diet Protein Hydrolysates Market include Fresenius Kabi AG, Abbott Laboratories, Nestle Health Science, Danone Nutricia, Ajinomoto Co., B. Braun Melsungen, Grifols S.A., Baxter/Vantive, Ajanta Pharma Limited, and Mankind Pharma Ltd. Companies operating in the Renal Diet Protein Hydrolysates Market follow several strategies to strengthen their competitive position. Many focus on developing more bioavailable formulations using advanced enzymatic processes that improve nutrient absorption and minimize metabolic load on the kidneys. Expanding product portfolios tailored to different CKD stages helps brands reach a broader patient base. Investments in clinical research support evidence-backed nutritional solutions and improve physician recommendations. Firms collaborate with healthcare providers and dietitians to increase the adoption of medical nutrition products. Geographic expansion through partnerships, distribution networks, and localized manufacturing enhances market accessibility.
Table of Contents
Chapter 1 Methodology & Scope
- 1.1 Market scope and definition
- 1.2 Research design
- 1.2.1 Research approach
- 1.2.2 Data collection methods
- 1.3 Data mining sources
- 1.3.1 Global
- 1.3.2 Regional/Country
- 1.4 Base estimates and calculations
- 1.4.1 Base year calculation
- 1.4.2 Key trends for market estimation
- 1.5 Primary research and validation
- 1.5.1 Primary sources
- 1.6 Forecast model
- 1.7 Research assumptions and limitations
Chapter 1 Executive Summary
- 2.1 Industry 3600 synopsis
- 2.2 Key market trends
- 2.2.1 Regional trends
- 2.2.2 Product type trends
- 2.2.3 CKD stage trends
- 2.2.4 Administration mode trends
- 2.2.5 Protein source trends
- 2.3 TAM Analysis, 2025-2034
- 2.4 CXO perspectives: Strategic imperatives
- 2.4.1 Executive decision points
- 2.4.2 Critical success factors
- 2.5 Future Outlook and Strategic Recommendations
Chapter 2 Industry Insights
- 3.1 Industry ecosystem analysis
- 3.1.1 Supplier landscape
- 3.1.2 Profit margin
- 3.1.3 Value addition at each stage
- 3.1.4 Factor affecting the value chain
- 3.1.5 Disruptions
- 3.2 Industry impact forces
- 3.2.1 Growth drivers
- 3.2.1.1 Rising CKD prevalence & aging demographics
- 3.2.1.2 Clinical evidence supporting plant-based protein hydrolysates
- 3.2.1.3 Technological advances in enzymatic hydrolysis
- 3.2.2 Industry pitfalls and challenges
- 3.2.2.1 High production costs & regulatory complexity
- 3.2.2.2 Limited clinical evidence for specific hydrolysates
- 3.2.3 Market opportunities
- 3.2.3.1 Personalized nutrition & precision medicine
- 3.2.3.2 Plant-based innovation & sustainability
- 3.2.1 Growth drivers
- 3.3 Growth potential analysis
- 3.4 Regulatory landscape
- 3.4.1 North America
- 3.4.2 Europe
- 3.4.3 Asia Pacific
- 3.4.4 Latin America
- 3.4.5 Middle East & Africa
- 3.5 Porter's analysis
- 3.6 PESTEL analysis
- 3.7 Price trends
- 3.7.1 By region
- 3.7.2 By product type
- 3.8 Future market trends
- 3.9 Technology and Innovation landscape
- 3.9.1 Current technological trends
- 3.9.2 Emerging technologies
- 3.10 Patent Landscape
- 3.11 Trade statistics (HS code) (Note: the trade statistics will be provided for key countries only)
- 3.11.1 Major importing countries
- 3.11.2 Major exporting countries
- 3.12 Sustainability and environmental aspects
- 3.12.1 Sustainable practices
- 3.12.2 Waste reduction strategies
- 3.12.3 Energy efficiency in production
- 3.12.4 Eco-friendly initiatives
- 3.13 Carbon footprint consideration
Chapter 3 Competitive Landscape, 2024
- 4.1 Introduction
- 4.2 Company market share analysis
- 4.2.1 By region
- 4.2.1.1 North America
- 4.2.1.2 Europe
- 4.2.1.3 Asia Pacific
- 4.2.1.4 LATAM
- 4.2.1.5 MEA
- 4.2.1 By region
- 4.3 Company matrix analysis
- 4.4 Competitive analysis of major market players
- 4.5 Competitive positioning matrix
- 4.6 Key developments
- 4.6.1 Mergers & acquisitions
- 4.6.2 Partnerships & collaborations
- 4.6.3 New Product Launches
- 4.6.4 Expansion Plans
Chapter 4 Market Estimates and Forecast, By Product Type, 2021-2034 (USD Billion) (Kilo Tons)
- 5.1 Key trends
- 5.2 Amino acid supplements
- 5.2.1 Alpha-ketoanalogues
- 5.2.2 Branched-chain amino acids (BCAAS)
- 5.2.3 Complete protein hydrolysates
- 5.3 Vitamin & mineral supplements
- 5.3.1 Water-soluble vitamins
- 5.3.2 Vitamin D analogues
- 5.3.3 Controlled mineral formulations
- 5.4 Mineral supplements
- 5.4.1 Iron supplements
- 5.4.2 Calcium-based products
- 5.4.3 Phosphorus-restricted formulations
- 5.5 Probiotics
- 5.5.1 Single-strain formulations
- 5.5.2 Multi-strain combinations
- 5.5.3 Synbiotic products
Chapter 5 Market Estimates and Forecast, By CKD Stage, 2021-2034 (USD Billion) (Kilo Tons)
- 6.1 Key trends
- 6.2 Pre-dialysis (CKD stages 1-5, non-dialysis)
- 6.2.1 Early-stage CKD (stages 1-2)
- 6.2.2 Moderate CKD (stage 3)
- 6.2.3 Advanced CKD (stages 4-5)
- 6.3 Hemodialysis patients
- 6.3.1 Conventional hemodialysis
- 6.3.2 High-flux hemodialysis
- 6.3.3 Hemodiafiltration
- 6.4 Peritoneal dialysis patients
- 6.4.1 Continuous ambulatory peritoneal dialysis (CAPD)
- 6.4.2 Automated peritoneal dialysis (APD)
- 6.5 End-stage renal disease (ESRD)
- 6.5.1 Pre-transplant patients
- 6.5.2 Conservative management
- 6.5.3 Acute kidney injury (AKI) recovery
Chapter 6 Market Estimates and Forecast, By Administration Mode, 2021-2034 (USD Billion) (Kilo Tons)
- 7.1 Key trends
- 7.2 Oral nutrition
- 7.2.1 Ready-to-drink formulations
- 7.2.2 Powder supplements
- 7.2.3 Solid dosage forms
- 7.3 Enteral nutrition
- 7.3.1 Tube feeding formulations
- 7.3.2 Oral nutritional supplements (ONS)
- 7.3.3 Modular products
- 7.4 Parenteral nutrition
- 7.4.1 Total parenteral nutrition (TPN)
- 7.4.2 Peripheral parenteral nutrition (PPN)
Chapter 7 Market Estimates and Forecast, By Protein Source, 2021-2034 (USD Billion) (Kilo Tons)
- 8.1 Key trends
- 8.2 Animal-based protein hydrolysates
- 8.2.1 Whey protein hydrolysates
- 8.2.2 Casein hydrolysates
- 8.2.3 Egg white protein hydrolysates
- 8.2.4 Fish protein hydrolysates
- 8.3 Plant-based protein hydrolysates
- 8.3.1 Pea protein hydrolysates
- 8.3.2 Soy protein hydrolysates
- 8.3.3 Rice protein hydrolysates
- 8.3.4 Hemp protein hydrolysates
Chapter 8 Market Estimates and Forecast, By Region, 2021-2034 (USD Billion) (Kilo Tons)
- 9.1 Key trends
- 9.2 North America
- 9.2.1 U.S.
- 9.2.2 Canada
- 9.3 Europe
- 9.3.1 Germany
- 9.3.2 UK
- 9.3.3 France
- 9.3.4 Spain
- 9.3.5 Italy
- 9.3.6 Rest of Europe
- 9.4 Asia Pacific
- 9.4.1 China
- 9.4.2 India
- 9.4.3 Japan
- 9.4.4 Australia
- 9.4.5 South Korea
- 9.4.6 Rest of Asia Pacific
- 9.5 Latin America
- 9.5.1 Brazil
- 9.5.2 Mexico
- 9.5.3 Argentina
- 9.5.4 Rest of Latin America
- 9.6 Middle East and Africa
- 9.6.1 Saudi Arabia
- 9.6.2 South Africa
- 9.6.3 UAE
- 9.6.4 Rest of Middle East and Africa
Chapter 9 Company Profiles
- 10.1 Fresenius Kabi AG
- 10.2 Abbott Laboratories
- 10.3 Nestle Health Science
- 10.4 Danone Nutricia
- 10.5 Ajinomoto Co.
- 10.6 B. Braun Melsungen
- 10.7 Grifols S.A.
- 10.8 Baxter/Vantive
- 10.9 Ajanta Pharma Limited
- 10.10 Mankind Pharma Ltd.

