
PUBLISHER: Mordor Intelligence | PRODUCT CODE: 1937399

PUBLISHER: Mordor Intelligence | PRODUCT CODE: 1937399
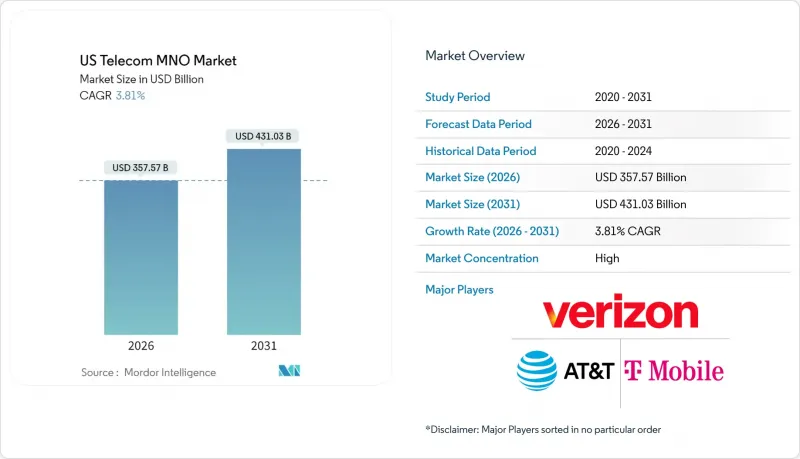
US Telecom MNO - Market Share Analysis, Industry Trends & Statistics, Growth Forecasts (2026 - 2031)
US Telecom MNO market size in 2026 is estimated at USD 357.57 billion, growing from 2025 value of USD 344.45 billion with 2031 projections showing USD 431.03 billion, growing at 3.81% CAGR over 2026-2031.
This steady trajectory reflects a mature arena in which legacy voice and messaging streams shrink while data-heavy applications, private cellular deployments, and integrated enterprise platforms expand margins. Heightened monetization of costly 5G assets is central to growth, with operators rolling out premium service tiers, network-as-a-service propositions, and low-latency edge nodes. Private and public sector subsidies for rural coverage, aggressive monetization of spectrum holdings, and AI-driven network automation continue to widen total addressable revenue pools. Competitive intensity remains contained because three national carriers dominate spectrum depth and retail distribution, allowing disciplined pricing even as prepaid churn rises. Capital discipline, energy optimization, and spectrum refarming collectively underpin operators' ability to fund continued densification without materially eroding free cash flow .
US Telecom MNO Market Trends and Insights
5G Stand-Alone Core Roll-outs Accelerating Data Monetization
Full migration to stand-alone (SA) architecture allows carriers to create virtual slices that guarantee latency and throughput, adding service differentiation unavailable on legacy non-stand-alone deployments. T-Mobile commercialized public-safety slices that already contribute USD 200 million in recurring annual revenue, while Verizon leverages SA to support sub-10 millisecond edge workloads for manufacturing robotics . Enterprise deals often bundle API exposure so developers can embed carrier-grade authentication and billing directly into applications, a pathway to an estimated USD 20 billion platform revenue pool by 2028 . Higher-value network slices translate into 3-5 times the ARPU of mass-market mobile broadband, directly lifting the US Telecom MNO market.
Fixed-Wireless Access (FWA) Displacing Legacy Copper
National FWA subscriptions crossed the 10 million mark by end-2024 as mid-band and C-band spectrum enabled 300 Mbps average downlink in rural clusters. The product directly cannibalizes outdated DSL and coax footprints, fills fiber coverage gaps, and accelerates operators' payback on 5G radios. FWA also strengthens household bundling, with wireless carriers attaching mobile lines at an 18% higher rate when a home internet account is present. Capacity constraints in dense suburbs trigger active-antenna expansions and spectrum-sharing algorithms, yet economics remain favorable relative to trenching. Rapid customer growth adds 0.8 percentage points to the US Telecom MNO market CAGR through 2027.
Inflation-Induced ARPU Pressure in Prepaid
Elevated energy and labor expenses compel carriers to raise plan prices, yet prepaid customers exhibit immediate churn when monthly bills climb by more than USD 5. AT&T's 2025 upward revisions triggered a temporary 190-basis-point increase in prepaid churn, forcing larger retention credits and marketing spend. Operators now extend inclusive content bundles, high-data allotments, and buy-now-pay-later device financing to defend subscriber counts, trimming EBITDA margin by 40-60 basis points over the near term.
Other drivers and restraints analyzed in the detailed report include:
- eSIM-Only Device Launches Simplifying Churn
- Federal BEAD and Middle-Mile Grants Stimulating Rural Build-outs
- Fiber Over-builds Eroding FWA Economics
For complete list of drivers and restraints, kindly check the Table Of Contents.
Segment Analysis
The data and internet category represented 53.12% of 2025 revenue, delivering the single-largest contribution to the US Telecom MNO market size. Unlimited smartphone plans, FWA subscriptions, and enterprise dedicated access collectively underpinned a 7.8% uplift in mobile data traffic per user year-on-year. Premium tiers exploiting carrier aggregation hit verified 5.5 Gbps throughput during 2025 field tests, reinforcing perceived speed leadership and justifying price differentials. Voice and SMS collectively fell below 10% revenue share as over-the-top substitutes drove double-digit usage declines. Meanwhile, IoT and M2M services posted the fastest trajectory, supported by 30 million incremental licensed cellular endpoints and a swelling pipeline of private network installs inside factories, ports, and hospitals. The sub-segment's 3.92% CAGR through 2031 adds a long-run lift that offsets eroding legacy lines, thereby sustaining expansion in the US Telecom MNO market.
Enterprise data contracts increasingly request SLA-backed throughput and network-slice isolation, commands that draw higher margins and longer-term commitments than consumer lines. Wholesale roaming and virtual operator partnerships add incremental revenue but primarily serve to amortize spectrum assets during off-peak hours. Advanced analytics embedded in self-optimizing networks slash power draw by around 15% and thereby release opex for reinvestment in additional small cells, further reinforcing data-centric positioning across the US Telecom MNO market.
The US Telecom MNO Market is Segmented by Service Type (Voice Services, Data and Internet Services, Messaging Services, Iot and M2M Services, OTT and PayTV Services, and Other Services), and End User (Enterprises, Consumer). The Market Forecasts are Provided in Terms of Value (USD) and Volume (Subscribers).
List of Companies Covered in this Report:
- Verizon Communications Inc.
- AT&T Inc.
- T-Mobile US, Inc.
Additional Benefits:
- The market estimate (ME) sheet in Excel format
- 3 months of analyst support
TABLE OF CONTENTS
1 INTRODUCTION
- 1.1 Study Assumptions and Market Definition
- 1.2 Scope of the Study
2 RESEARCH METHODOLOGY
3 EXECUTIVE SUMMARY
4 MARKET LANDSCAPE
- 4.1 Market Overview
- 4.2 Regulatory and Policy Framework
- 4.3 Spectrum Landscape and Competitive Holdings
- 4.4 Telecom Industry Ecosystem
- 4.5 Macroeconomic and External Drivers
- 4.6 Porter's Five Forces Analysis
- 4.6.1 Competitive Rivalry
- 4.6.2 Threat of New Entrants
- 4.6.3 Bargaining Power of Suppliers
- 4.6.4 Bargaining Power of Buyers
- 4.6.5 Threat of Substitutes
- 4.7 Key MNO KPIs (2020-2025)
- 4.7.1 Unique Mobile Subscribers and Penetration Rate
- 4.7.2 Mobile Internet Users and Penetration Rate
- 4.7.3 SIM Connections by Access Technology and Penetration
- 4.7.4 Cellular IoT / M2M Connections
- 4.7.5 Broadband Connections (Mobile and Fixed)
- 4.7.6 ARPU (Average Revenue Per User)
- 4.7.7 Average Data Usage per Subscription (GB/month)
- 4.8 Market Drivers
- 4.8.1 5G Stand-Alone Core Roll-outs Accelerating Data-Monetization
- 4.8.2 Fixed-Wireless Access (FWA) Displacing Legacy Copper
- 4.8.3 eSIM-Only Device Launches Simplifying Churn
- 4.8.4 Federal BEAD and Middle-Mile Grants Stimulating Rural Build-outs
- 4.8.5 Private-Cellular Demand from IIoT and Campus Networks
- 4.8.6 AI-Driven RAN Optimization Lowering OPEX
- 4.9 Market Restraints
- 4.9.1 Inflation-Induced ARPU Pressure in Pre-paid
- 4.9.2 Fiber Over-builds Eroding FWA Economics
- 4.9.3 C-Band Aviation Mitigation Costs
- 4.9.4 Heightened FCC Scrutiny on MandA
- 4.10 Technological Outlook
- 4.11 Analysis of key business models in Telecom Sector
- 4.12 Analysis of Pricing Models and Pricing
5 MARKET SIZE AND GROWTH FORECASTS (VALUE)
- 5.1 Overall Telecom Revenue and ARPU
- 5.2 Service Type
- 5.2.1 Voice Services
- 5.2.2 Data and Internet Services
- 5.2.3 Messaging Services
- 5.2.4 IoT and M2M Services
- 5.2.5 OTT and PayTV Services
- 5.2.6 Other Services (VAS, Roaming and International Services, Enterprise and Wholesale Services, etc.)
- 5.3 End-user
- 5.3.1 Enterprises
- 5.3.2 Consumer
6 COMPETITIVE LANDSCAPE
- 6.1 Market Concentration
- 6.2 Strategic Moves and Investments by key vendors, 2023-2025
- 6.3 Market share analysis for MNOs, 2024
- 6.4 Product Benchmarking Analysis for mobile network services
- 6.5 MNO snapshot (subscribers, churn rate, ARPU, etc.)
- 6.6 Company Profiles* of MNOs (Includes Business Overview | Service Portfolio | Financials | Business Strategy and Recent Developments | SWOT Analysis)
- 6.6.1 Verizon Communications Inc.
- 6.6.2 AT&T Inc.
- 6.6.3 T-Mobile US, Inc.
7 MARKET OPPORTUNITIES AND FUTURE OUTLOOK
- 7.1 White-space and Unmet-Need Assessment

