
PUBLISHER: Mordor Intelligence | PRODUCT CODE: 1940760

PUBLISHER: Mordor Intelligence | PRODUCT CODE: 1940760
US E-Commerce - Market Share Analysis, Industry Trends & Statistics, Growth Forecasts (2026 - 2031)
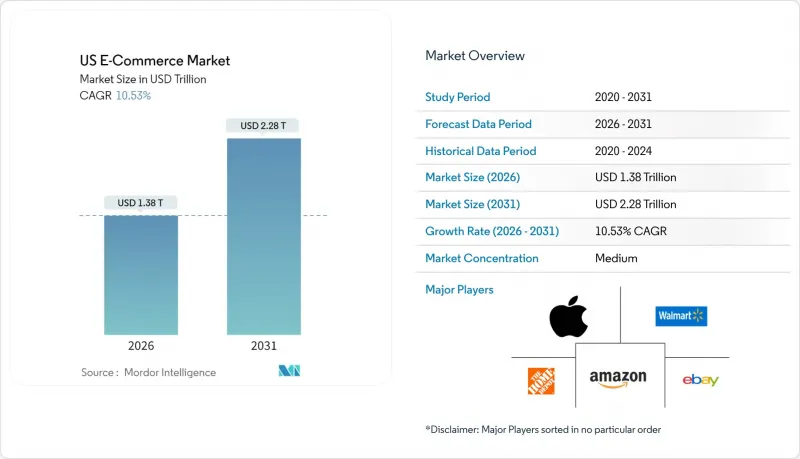
US ecommerce market size in 2026 is estimated at USD 1,381.6 billion, growing from 2025 value of USD 1,250 billion with 2031 projections showing USD 2,279.2 billion, growing at 10.53% CAGR over 2026-2031.
Robust spending on digital channels, continuous gains in mobile commerce, and deeper integration of embedded finance offset the tapering of pandemic-era tailwinds. Mobile now drives the majority of online checkouts and acts as a catalyst for same-day service expectations, while generative AI lifts conversion by reducing the friction between search intent and product discovery. Category growth remains uneven: consumer electronics retains the largest revenue base, but online grocery and food delivery accelerate fastest as retailers deploy micro-fulfilment centres. Regulatory shifts, including tighter de minimis rules on cross-border parcels, push merchants to re-engineer supply chains yet also open white space for domestic third-party logistics platforms. Competitive intensity rises as Walmart, Shein, and Temu chip away at Amazon's leadership, and as B2B marketplaces draw manufacturers directly into the digital arena.
US E-Commerce Market Trends and Insights
Rapid Adoption of Same-Day and Instant Delivery Models in US Metros
Retailers in New York, Los Angeles, and other high-density markets are rolling out micro-fulfilment centres that cut order processing times by up to 90% and reduce the final-mile distance traveled. Same-day options drive an 18% uplift in checkout conversion, prompting merchants to publicise delivery speed as prominently as price. Although 90% of shoppers still accept two-day service when fees fall, the ability to offer a calibrated mix of speed and cost is emerging as a differentiator. Major grocery chains emulate Amazon's local hub network by co-locating dark stores near urban demand pockets, shrinking fulfilment radii from 12 miles to less than five. Investments ramp from pilot stage to chain-wide roll-outs between 2025 and 2027, firmly embedding instant delivery expectations into the US ecommerce market.
Online Grocery Penetration Post-COVID via Micro-Fulfilment Investments
Digital grocery sales rose 4.2% in 2024 and are on track to climb 9.7% in 2025, propelled by automation that raises pick accuracy and slashes perishables waste. Retailers such as Walmart and Albertsons run compact, 10,000-20,000 sq ft automated sites capable of processing online orders ten times faster than legacy store-based picking. Seventy-two percent of grocers plan new platform investments in 2025 to tackle USD 7.4 billion in annual lost sales from out-of-stocks, tying fulfilment efficiency directly to topline growth. AI forecasting aligned with micro-fulfilment improves inventory turns and frees store staff for value-added tasks. Stronger urban adoption anchors the near-term impact, yet suburban expansion is pencilled in for 2026-2027 as cost curves fall.
Last-Mile Delivery Cost Inflation and Carrier Surcharges
UPS and FedEx implemented 5.9% base rate hikes for 2025, layered with oversized and remote-area fees that lift effective parcel expenses by 10-12% for small sellers. Additional handling charges jumped 26% year-over-year, and peak-season levies reach USD 99 per large parcel. This cost pressure trickles into higher retail prices or erodes margins when free shipping remains table stakes. Rural shoppers feel the greatest pinch due to limited carrier alternatives, widening the urban-rural fulfilment divide inside the US ecommerce market. Merchants experiment with regional carriers, in-store pick-up, and subscription-style paid membership to spread freight overhead across predictable revenue streams.
Other drivers and restraints analyzed in the detailed report include:
- BNPL and Embedded Finance Boosting High-Ticket Conversions
- Generative-AI Product Discovery Enhancing Conversion Rates
- High Product-Return Rates Driving Reverse-Logistics Costs
For complete list of drivers and restraints, kindly check the Table Of Contents.
Segment Analysis
The B2C stream contributed 87.30% of US ecommerce transactions in 2025, a share that underscores its entrenched position among consumers. Nevertheless, B2B digital commerce is projected to outpace the broader US ecommerce market, expanding at a 12.55% CAGR to 2031 as industrial buyers migrate online. This surge reflects a demographic turnover: millennials are forecast to represent 70% of professional purchasers by 2025, pushing suppliers toward intuitive, consumer-grade interfaces. Advanced analytics adoption now reaches 86% of B2B sellers, fueling personalised catalogs and real-time inventory visibility.
A platform shift underpins this growth. Marketplace participation already involves 59% of B2B buyers, redirecting spend from traditional distribution to digital self-service paths. Subscription pricing models further reinforce loyalty, with the total subscription economy inside the segment projected at USD 1.5 trillion by 2025. As a result, US ecommerce market size forecasts show B2B's contribution moving from the periphery to a material share of online GMV, though B2C still magnifies absolute dollars due to its sheer scale.
Smartphones generated 71.80% of US ecommerce checkouts in 2025 and are forecast to compound at 11.85% through 2031, cementing a mobile-first paradigm. Despite high usage, conversion on small screens trails desktop by 35.1%, leaving optimisation headroom. Native apps outperform responsive sites by 30% on conversion, encouraging retailers to shift budget from desktop upgrades to mobile features like one-tap checkout.
Daily mobile screen time averages 4.4 hours, 88% of which occurs in apps. Mobile wallets are set to handle USD 190 billion in 2024, equivalent to more than half of digital payments. Augmented reality features drive deeper engagement, with 90% of mobile shoppers open to AR try-ons. These advances improve the proportion of mobile sales inside the US ecommerce market size, closing the performance gap with desktop over the forecast horizon.
The United States E-Commerce Market Report is Segmented by Business Model (B2C, B2B), Device Type (Smartphone / Mobile, Desktop and Laptop, Other Device Types), Payment Method (Credit / Debit Cards, Digital Wallets, BNPL, Other Payment Method), B2C Product Category (Beauty and Personal Care, Consumer Electronics, Fashion and Apparel, and More). The Market Forecasts are Provided in Terms of Value (USD).
List of Companies Covered in this Report:
- Amazon.com, Inc.
- Walmart Inc.
- eBay Inc.
- Apple Inc.
- The Home Depot, Inc.
- Shopify Inc.
- Costco Wholesale Corporation
- Target Corporation
- Best Buy Co., Inc.
- Wayfair Inc.
- The Kroger Co.
- Etsy, Inc.
- Chewy, Inc.
- Overstock.com, Inc.
- Lowe's Companies, Inc.
- Macy's, Inc.
- Nordstrom, Inc.
- PDD Holdings Inc. (Temu)
- SHEIN Group Ltd.
- Alibaba Group Holding Ltd. (AliExpress US)
Additional Benefits:
- The market estimate (ME) sheet in Excel format
- 3 months of analyst support
TABLE OF CONTENTS
1 INTRODUCTION
- 1.1 Study Assumptions and Market Definition
- 1.2 Scope of the Study
2 RESEARCH METHODOLOGY
3 EXECUTIVE SUMMARY
4 MARKET LANDSCAPE
- 4.1 Market Overview
- 4.2 Market Drivers
- 4.2.1 Rapid Adoption of Same-Day and Instant Delivery Models in US Metros
- 4.2.2 Online Grocery Penetration Post-COVID via Micro-Fulfilment Investments
- 4.2.3 BNPL and Embedded Finance Boosting High-Ticket Conversions
- 4.2.4 Cross-Border Demand for US DTC Brands via Section 321 De-Minimis
- 4.2.5 SMB Marketplace Adoption Transitioning from Wholesale to DTC
- 4.2.6 Generative-AI Product Discovery Enhancing Conversion Rates
- 4.3 Market Restraints
- 4.3.1 Last-Mile Delivery Cost Inflation and Carrier Surcharges
- 4.3.2 State-Level Data-Privacy Rules Complicating Personalisation
- 4.3.3 High Product-Return Rates Driving Reverse-Logistics Costs
- 4.3.4 US Antitrust Scrutiny Limiting Platform Fee Expansion
- 4.4 Value Chain Analysis
- 4.5 Regulatory Outlook
- 4.6 Porter's Five Forces Analysis
- 4.6.1 Bargaining Power of Suppliers
- 4.6.2 Bargaining Power of Buyers / Consumers
- 4.6.3 Threat of New Entrants
- 4.6.4 Threat of Substitute Products
- 4.6.5 Intensity of Competitive Rivalry
- 4.7 Key Market Trends and Share of E-commerce in Total Retail
- 4.8 Impact of Macroeconomic Factors on E-commerce Sales
- 4.9 Investment Analysis
- 4.10 Analysis of key demographic trends and patterns related to E-commerce industry in United States (Coverage to include Population, Internet Penetration, E-commerce Penetration, Age and Income etc.)
- 4.11 Analysis of cross-border E-commerce industry in United States (Current market value of cross-border and key trends)
- 4.12 Current positioning of country United States in the E-commerce industry in region North America
5 MARKET SIZE AND GROWTH FORECASTS (VALUES)
- 5.1 By Business Model
- 5.1.1 B2C
- 5.1.2 B2B
- 5.2 By Device Type
- 5.2.1 Smartphone / Mobile
- 5.2.2 Desktop and Laptop
- 5.2.3 Other Device Types
- 5.3 By Payment Method
- 5.3.1 Credit / Debit Cards
- 5.3.2 Digital Wallets
- 5.3.3 BNPL
- 5.3.4 Other Payment Method
- 5.4 By B2C Product Category
- 5.4.1 Beauty and Personal Care
- 5.4.2 Consumer Electronics
- 5.4.3 Fashion and Apparel
- 5.4.4 Food and Beverages
- 5.4.5 Furniture and Home
- 5.4.6 Toys, DIY and Media
- 5.4.7 Other Product Categories
6 COMPETITIVE LANDSCAPE
- 6.1 Market Concentration
- 6.2 Strategic Moves
- 6.3 Market Share Analysis
- 6.4 Company Profiles (includes Global level Overview, Market level overview, Core Segments, Financials as available, Strategic Information, Market Rank/Share for key companies, Products and Services, and Recent Developments)
- 6.4.1 Amazon.com, Inc.
- 6.4.2 Walmart Inc.
- 6.4.3 eBay Inc.
- 6.4.4 Apple Inc.
- 6.4.5 The Home Depot, Inc.
- 6.4.6 Shopify Inc.
- 6.4.7 Costco Wholesale Corporation
- 6.4.8 Target Corporation
- 6.4.9 Best Buy Co., Inc.
- 6.4.10 Wayfair Inc.
- 6.4.11 The Kroger Co.
- 6.4.12 Etsy, Inc.
- 6.4.13 Chewy, Inc.
- 6.4.14 Overstock.com, Inc.
- 6.4.15 Lowe's Companies, Inc.
- 6.4.16 Macy's, Inc.
- 6.4.17 Nordstrom, Inc.
- 6.4.18 PDD Holdings Inc. (Temu)
- 6.4.19 SHEIN Group Ltd.
- 6.4.20 Alibaba Group Holding Ltd. (AliExpress US)
7 MARKET OPPORTUNITIES AND FUTURE OUTLOOK
- 7.1 White-space and Unmet-Need Assessment

