
PUBLISHER: Mordor Intelligence | PRODUCT CODE: 2073593

PUBLISHER: Mordor Intelligence | PRODUCT CODE: 2073593
United States Micronutrient Fertilizer - Market Share Analysis, Industry Trends & Statistics, Growth Forecasts (2026 - 2031)
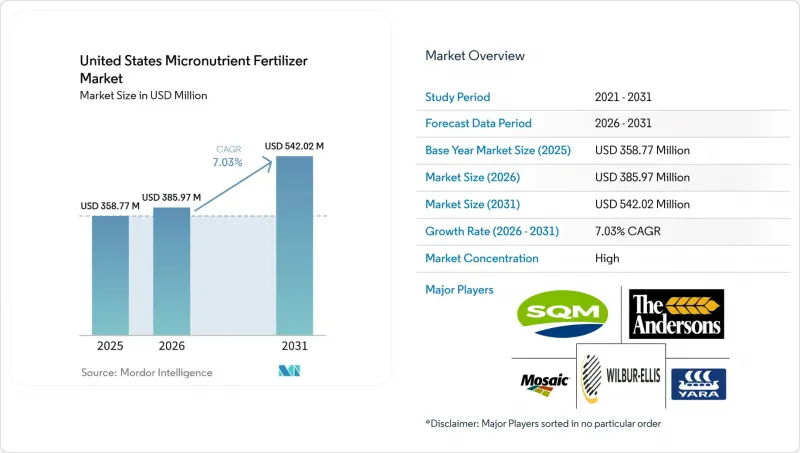
According to Mordor Intelligence, the united states micronutrient fertilizer market size is projected to grow from USD 358.77 million in 2025 to USD 385.97 million in 2026 and is forecast to reach USD 542.02 million by 2031 at 7.03% CAGR over 2026-2031.
This report is Segmented by Product (Boron, Copper, Iron, Manganese, Molybdenum, Zinc, Others), Form (Conventional and Specialty), Application Mode (Fertigation, Foliar, Soil), and Crop Type (Field Crops, Horticultural Crops, Turf & Ornamental). The Market Forecasts are Provided in Terms of Value (USD) and Volume (Metric Tons).
United States Micronutrient Fertilizer Market Trends and Insights
Precision-Rate Micronutrient Application
Variable-rate spreaders and liquid injectors now deliver zinc, boron, or blended packages at 0.5-4 lb per acre within a single pass, matching spatial variability identified through grid sampling and yield maps. University field trials show 15-25% higher nutrient-use efficiency and lower total applied pounds relative to uniform rates. Equipment makers bundle micronutrient modules into existing hardware, cutting incremental costs and accelerating adoption across the United States micronutrient fertilizers market. Retail agronomists leverage the data layer to document environmental benefits for USDA programs and carbon registries, further strengthening farmers.
Documented zinc and boron shortages
Soil surveys reveal 47% of eastern Nebraska fields below critical zinc thresholds, with 31% also lacking boron. Higher yields, phosphorus antagonism, and minimal tillage intensify the risks of shortages. As the United States micronutrient fertilizers market pivots toward routine tissue and soil diagnostics every three to four years, demand for granular zinc sulfate, boric acid, and chelated liquids rises. Agronomists calculate that correcting severe deficiencies can add 10-20 bushels per acre in corn, easily covering an extra USD 15-25 per-acre expenditure on micronutrients.
Price premium versus N-P-K
The cost differential between micronutrient applications and traditional N-P-K fertilizers creates economic resistance among broad-acre farmers operating on thin profit margins. Micronutrient blends cost USD 15-25 per acre, compared to USD 8-12 for N-P-K. With row-crop margins often ranging from USD 50 to USD 150 per acre, growers hesitate unless a clear yield improvement is proven. Trials indicate a break-even point at 3-5 bushels per acre (bu) corn or 1-2 bushels per acre (bu) soybean yield gains, with results not uniform across soil types . This restraint limits the penetration of United States micronutrient fertilizers into clearly deficient fields.
Other drivers and restraints analyzed in the detailed report include:
- Specialty-crop acreage expansion
- USDA cost-share for micronutrient plans
- Tank-mix issues with phosphate starters
For complete list of drivers and restraints, kindly check the Table Of Contents.
Segment Analysis
Zinc held the largest United States micronutrient fertilizers market share at 31.5% in 2025, supported by widespread use across corn, soybean, and wheat production, where zinc deficiencies remain common in high-yielding systems. Sustained demand from zinc-deficient and alkaline soils, coupled with high-pH irrigation conditions, reinforces its position. Copper also remains an important product category due to its nutritional benefits and use in certain crop protection programs across corn, soybean, and specialty crop production, while boron continues to gain traction in deficiency-prone regions despite its relatively narrow application margins.
Molybdenum, though a smaller segment, is the fastest-growing product category, with a projected CAGR of 7.3% through 2031. Growth is driven by increasing emphasis on biological nitrogen fixation and nitrogen-use efficiency, particularly in legume production systems. Ongoing research into mechanochemically modified Mo-Zn composites with slow-release nutrient delivery characteristics may support future product innovation within the segment. Additionally, advancements in second-generation chelates and dry dispersible powder formulations improve performance in calcareous soils, enabling premium pricing opportunities. Specialty growers in California are increasingly adopting multi-micronutrient application programs that favor tank-stable blends for both drip and aerial applications, supporting broader micronutrient market expansion.
Conventional sulfates, oxides, and basic salts accounted for 76.3% of the United States micronutrient fertilizer market size in 2025, due to their low cost and broad availability. Despite dominance, specialty forms are growing at a 6.6% CAGR through 2031. Liquids enable uniform, variable-rate placement alongside herbicides, while controlled-release coatings reduce leaching and soil tie-up, which is critical in sandy Florida citrus groves. Water-soluble powders boost foliar uptake for horticulture and turf managers. Field evidence shows yield benefits and simplified logistics offsetting premiums, especially where carbon programs grant additional value for efficiency gains.
Advances in polymer coatings and nano-encapsulation drive differentiation as suppliers seek to expand their margins beyond basic commodities. Investments in proprietary chemistries by market leaders signal a strategic pivot to specialty value pools, elevating the overall sophistication of the United States micronutrient fertilizers industry.
Complete Report Scope:
- Product
- Boron
- Copper
- Iron
- Manganese
- Molybdenum
- Zinc
- Others
- Form
- Conventional
- Speciality
- CRF
- Liquid Fertilizer
- SRF
- Water Soluble
- Application
- Soil
- Foliar
- Fertigation
- Crop Type
- Field Crops
- Horticultural Crops
- Turf & Ornamental
List of Companies Covered in this Report:
- The Mosaic Company
- The Andersons Inc.
- Yara International ASA
- Wilbur-Ellis Company LLC
- Sociedad Quimica y Minera de Chile SA
- Nutrien Ltd.
- Helena Agri-Enterprises LLC (Marubeni Corp.)
- Brandt Inc.
- Koch Agronomic Services (Koch Industries Inc.)
- Nouryon
- Haifa Group
- ICL Group Ltd.
- BASF SE
Additional Benefits:
- The market estimate (ME) sheet in Excel format
- 3 months of analyst support
TABLE OF CONTENTS
1 INTRODUCTION
- 1.1 Study Assumptions & Market Definition
- 1.2 Scope of the Study
- 1.3 Research Methodology
2 REPORT OFFERS
3 EXECUTIVE SUMMARY & KEY FINDINGS
4 KEY INDUSTRY TRENDS
- 4.1 Acreage Of Major Crop Types
- 4.1.1 Field Crops
- 4.1.2 Horticultural Crops
- 4.2 Average Nutrient Application Rates
- 4.2.1 Micronutrients
- 4.2.1.1 Field Crops
- 4.2.1.2 Horticultural Crops
- 4.2.1 Micronutrients
- 4.3 Regulatory Framework
- 4.4 Value Chain & Distribution Channel Analysis
- 4.5 Market Drivers
- 4.5.1 Precision-Rate Micronutrient Application Gains Traction
- 4.5.2 Rising Zinc and Boron Deficiencies in Corn Belt Soils
- 4.5.3 Expansion of Specialty-Crop Acreage in California and Florida
- 4.5.4 USDA Cost-Share Programs Cover Micronutrient Plans
- 4.5.5 Emergence of In-Furrow Chelated Blends for Low-pH Soils
- 4.5.6 Carbon-Credit Programs Reward Higher Nutrient-Use Efficiency
- 4.6 Market Restraints
- 4.6.1 Price Premium Versus N-P-K Discourages Broad-Acre Adoption
- 4.6.2 Volatility in Corn and Soybean Prices Affecting Input Spend
- 4.6.3 Tank-Mix Compatibility Issues with Phosphate Starters
- 4.6.4 Regenerative "Input-Light" Movements Among Large Growers
5 MARKET SIZE AND GROWTH FORECASTS (VALUE AND VOLUME)
- 5.1 Product
- 5.1.1 Boron
- 5.1.2 Copper
- 5.1.3 Iron
- 5.1.4 Manganese
- 5.1.5 Molybdenum
- 5.1.6 Zinc
- 5.1.7 Others
- 5.2 Form
- 5.2.1 Conventional
- 5.2.2 Speciality
- 5.2.2.1 CRF
- 5.2.2.2 Liquid Fertilizer
- 5.2.2.3 SRF
- 5.2.2.4 Water Soluble
- 5.3 Application
- 5.3.1 Soil
- 5.3.2 Foliar
- 5.3.3 Fertigation
- 5.4 Crop Type
- 5.4.1 Field Crops
- 5.4.2 Horticultural Crops
- 5.4.3 Turf & Ornamental
6 COMPETITIVE LANDSCAPE
- 6.1 Key Strategic Moves
- 6.2 Market Share Analysis
- 6.3 Company Landscape
- 6.4 Company Profiles
- 6.4.1 The Mosaic Company
- 6.4.2 The Andersons Inc.
- 6.4.3 Yara International ASA
- 6.4.4 Wilbur-Ellis Company LLC
- 6.4.5 Sociedad Quimica y Minera de Chile SA
- 6.4.6 Nutrien Ltd.
- 6.4.7 Helena Agri-Enterprises LLC (Marubeni Corp.)
- 6.4.8 Brandt Inc.
- 6.4.9 Koch Agronomic Services (Koch Industries Inc.)
- 6.4.10 Nouryon
- 6.4.11 Haifa Group
- 6.4.12 ICL Group Ltd.
- 6.4.13 BASF SE
7 KEY STRATEGIC QUESTIONS FOR FERTILIZER CEOS

