
PUBLISHER: Mordor Intelligence | PRODUCT CODE: 2073607

PUBLISHER: Mordor Intelligence | PRODUCT CODE: 2073607
Micronutrient Fertilizer - Market Share Analysis, Industry Trends & Statistics, Growth Forecasts (2026 - 2031)
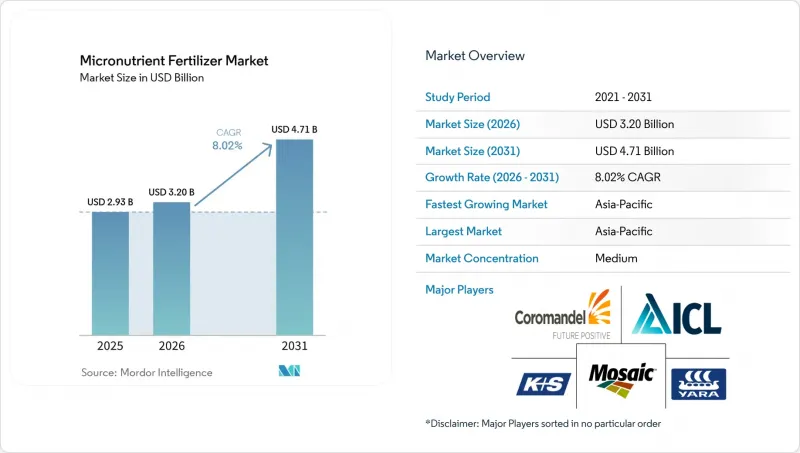
According to Mordor Intelligence, the micronutrient fertilizer market size was valued at USD 2.93 billion in 2025 and is projected to grow from USD 3.20 billion in 2026 to USD 4.71 billion by 2031, registering a CAGR of 8.0% during the forecast period.
This report is Segmented by Product (Boron, Copper, Iron, Manganese, Molybdenum, Zinc, Others), Application Mode (Fertigation, Foliar, Soil), by Crop Type (Field Crops, Horticultural Crops, Turf and Ornamental), and by Region (Asia-Pacific, Europe, Middle East and Africa, North America, South America). The Market Forecasts are Provided in Terms of Value (USD) and Volume (Metric Tons).
Global Micronutrient Fertilizer Market Trends and Insights
Widespread Soil Micronutrient Deficiencies in Intensive Cereal Belts
India's 2024 soil health card audit revealed zinc deficiency in 49% of districts, a seven percentage point increase since 2019, while boron shortfalls affected one-third of sampled plots . Wheat yields in China's Henan province stagnated at 5.8 metric tons per ha from 2020 to 2024, even as nitrogen use climbed 12% because trace-element co-factors remained limiting. Indonesia's Ministry of Agriculture distributed 120,000 metric tons of zinc-fortified NPK in 2024, boosting paddy yields by 8% in pilot plots. The underlying driver is the ongoing decline in organic matter, which reduces natural chelation and ensures structural demand.
Rapid Adoption of Precision-Application Equipment
GPS-enabled applicators reduced zinc sulfate use by 22% per hectare across 340 European farms in 2024, while increasing leaf zinc concentrations by 15%. John Deere noted that 18% of 2024 sprayer sales included micronutrient injectors, up from 11% in 2022. Drone-guided foliar boron in Canadian canola increased seed set by 9%. These gains simultaneously lower over-application risks, an emerging environmental compliance need flagged by the Commonwealth Scientific and Industrial Research Organisation (CSIRO).
High Price Volatility of Key Mineral Ores
Zinc sulfate traded between USD 1,200 and USD 1,680 per metric ton in 2024, compressing formulator margins that average 8-12%. Copper sulfate reached USD 2,400 per metric ton in mid-2024, causing some South American soybean growers to defer foliar copper applications, which resulted in a 6% decline in regional micronutrient volumes in H1 2024. Mosaic hedged 40% of its zinc sulfate inputs to cushion volatility.
Other drivers and restraints analyzed in the detailed report include:
- Expansion of High-Value Horticulture Under Protected Cultivation
- Government Micronutrient Subsidy Programs in South and Southeast Asia
- Low Farmer Awareness in Sub-Saharan Africa and Parts of South America
For complete list of drivers and restraints, kindly check the Table Of Contents.
Segment Analysis
Zinc accounted for the largest share of the micronutrient fertilizer market, representing 38.4% in 2025. This dominance is attributed to its essential role in plant growth, enzyme activation, and yield improvement across major field and horticultural crops. Zinc-based fertilizers are widely adopted, particularly in regions with documented soil micronutrient deficiencies and intensive cropping systems. Market expansion is further supported by product innovations, including enhanced-efficiency formulations such as coated and chelated zinc products, which improve nutrient availability and uptake efficiency under diverse soil conditions.
Boron is projected to be the fastest-growing segment, with a 7.5% CAGR during 2026-2031. This growth is driven by the increasing cultivation of oilseeds, fruits, vegetables, and other high-value crops, where boron plays a critical role in flowering, fruit set, pollination, and overall crop quality. The rising adoption of precision nutrient management practices and fertigation systems is further boosting demand for boron fertilizers. Additionally, growing awareness of boron deficiencies and their impact on crop productivity is encouraging the use of boron-based products in both developed and emerging agricultural markets.
Complete Report Scope:
- By Product
- Boron
- Copper
- Iron
- Manganese
- Molybdenum
- Zinc
- Others
- By Application Mode
- Fertigation
- Foliar
- Soil
- By Crop Type
- Field Crops
- Horticultural Crops
- Turf and Ornamental
- By Geography
- Asia-Pacific
- Australia
- Bangladesh
- China
- India
- Indonesia
- Japan
- Pakistan
- Philippines
- Thailand
- Vietnam
- Rest of Asia-Pacific
- Europe
- France
- Germany
- Italy
- Netherlands
- Russia
- Spain
- Ukraine
- United Kingdom
- Rest of Europe
- Middle East And Africa
- Nigeria
- Saudi Arabia
- South Africa
- Turkey
- Rest of Middle East And Africa
- North America
- Canada
- Mexico
- United States
- Rest of North America
- South America
- Argentina
- Brazil
- Rest of South America
- Asia-Pacific
Geography Analysis
In 2025, the Asia-Pacific region accounted for the largest share of the micronutrient fertilizer market at 39.1%. It is also projected to be the fastest-growing regional market, with a CAGR of 8.9% during the forecast period of 2026-2031. This growth is driven by the extensive agricultural production systems across China, India, and Southeast Asian countries. The increasing focus on balanced nutrient management and addressing micronutrient deficiencies is a key factor boosting demand. Additionally, the rising adoption of specialty fertilizers, precision agriculture practices, and high-value crop cultivation further strengthens the market position in this region.
North America and Europe are considered mature yet strategically significant markets for micronutrient fertilizers. The demand in these regions is supported by the widespread use of precision farming technologies, advanced soil testing methods, and chelated micronutrient products. Furthermore, regulatory emphasis on nutrient-use efficiency and sustainable agricultural practices is encouraging farmers to implement targeted micronutrient application programs for both field and horticultural crops.
The Middle East and Africa, along with South America, are emerging as key growth markets due to agricultural modernization and the expansion of commercial farming activities. Investments in irrigation infrastructure, improved fertilizer accessibility, and productivity enhancement programs are driving the adoption of micronutrient fertilizers in these regions. In South America, the increasing cultivation of crops such as soybean, corn, fruits, and vegetables supports market growth. Meanwhile, countries in the Middle East and Africa are focusing on improving crop productivity through balanced plant nutrition strategies.
- Yara International ASA
- The Mosaic Company
- ICL Group Ltd
- K+S Aktiengesellschaft
- Coromandel International Ltd
- Koch Agronomic Services (Koch Industries)
- BASF SE
- FMC Corporation
- SQM S.A.
- Haifa Group
- Compass Minerals International Inc.
- Nouryon
- Nufarm Limited
- Brandt Consolidated Inc.
- BMS Micro-Nutrients NV
Additional Benefits:
- The market estimate (ME) sheet in Excel format
- 3 months of analyst support
TABLE OF CONTENTS
1 INTRODUCTION
- 1.1 Study Assumptions and Market Definition
- 1.2 Scope of the Study
- 1.3 Research Methodology
2 REPORT OFFERS
3 EXECUTIVE SUMMARY AND KEY FINDINGS
4 KEY INDUSTRY TRENDS
- 4.1 Acreage Of Major Crop Types
- 4.1.1 Field Crops
- 4.1.2 Horticultural Crops
- 4.2 Average Nutrient Application Rates
- 4.2.1 Micronutrients
- 4.2.1.1 Field Crops
- 4.2.1.2 Horticultural Crops
- 4.2.1 Micronutrients
- 4.3 Agricultural Land Equipped For Irrigation
- 4.4 Regulatory Framework
- 4.5 Value Chain And Distribution Channel Analysis
- 4.6 Market Drivers
- 4.6.1 Widespread soil micronutrient deficiencies in intensive cereal belts
- 4.6.2 Rapid adoption of precision-application equipment
- 4.6.3 Expansion of high-value horticulture under protected cultivation
- 4.6.4 Government micronutrient subsidy programs in South and Southeast Asia
- 4.6.5 Bio-fortification initiatives against hidden hunger
- 4.6.6 Nanochelated formulations offering higher uptake efficiency
- 4.7 Market Restraints
- 4.7.1 High price volatility of key mineral ores
- 4.7.2 Low farmer awareness in Sub-Saharan Africa and parts of South America
- 4.7.3 Antagonistic interactions in multi-nutrient blends
- 4.7.4 Stricter limits on heavy-metal contaminants
5 5. MARKET SIZE AND GROWTH FORECASTS (VALUE AND VOLUME)
- 5.1 By Product
- 5.1.1 Boron
- 5.1.2 Copper
- 5.1.3 Iron
- 5.1.4 Manganese
- 5.1.5 Molybdenum
- 5.1.6 Zinc
- 5.1.7 Others
- 5.2 By Application Mode
- 5.2.1 Fertigation
- 5.2.2 Foliar
- 5.2.3 Soil
- 5.3 By Crop Type
- 5.3.1 Field Crops
- 5.3.2 Horticultural Crops
- 5.3.3 Turf and Ornamental
- 5.4 By Geography
- 5.4.1 Asia-Pacific
- 5.4.1.1 Australia
- 5.4.1.2 Bangladesh
- 5.4.1.3 China
- 5.4.1.4 India
- 5.4.1.5 Indonesia
- 5.4.1.6 Japan
- 5.4.1.7 Pakistan
- 5.4.1.8 Philippines
- 5.4.1.9 Thailand
- 5.4.1.10 Vietnam
- 5.4.1.11 Rest of Asia-Pacific
- 5.4.2 Europe
- 5.4.2.1 France
- 5.4.2.2 Germany
- 5.4.2.3 Italy
- 5.4.2.4 Netherlands
- 5.4.2.5 Russia
- 5.4.2.6 Spain
- 5.4.2.7 Ukraine
- 5.4.2.8 United Kingdom
- 5.4.2.9 Rest of Europe
- 5.4.3 Middle East And Africa
- 5.4.3.1 Nigeria
- 5.4.3.2 Saudi Arabia
- 5.4.3.3 South Africa
- 5.4.3.4 Turkey
- 5.4.3.5 Rest of Middle East And Africa
- 5.4.4 North America
- 5.4.4.1 Canada
- 5.4.4.2 Mexico
- 5.4.4.3 United States
- 5.4.4.4 Rest of North America
- 5.4.5 South America
- 5.4.5.1 Argentina
- 5.4.5.2 Brazil
- 5.4.5.3 Rest of South America
- 5.4.1 Asia-Pacific
6 COMPETITIVE LANDSCAPE
- 6.1 Key Strategic Moves
- 6.2 Market Share Analysis
- 6.3 Company Landscape
- 6.4 Company Profiles (includes Global Level Overview, Market Level Overview, Core Business Segments, Financials, Headcount, Key Information, Market Rank, Market Share, Products and Services, and Analysis of Recent Developments).
- 6.4.1 Yara International ASA
- 6.4.2 The Mosaic Company
- 6.4.3 ICL Group Ltd
- 6.4.4 K+S Aktiengesellschaft
- 6.4.5 Coromandel International Ltd
- 6.4.6 Koch Agronomic Services (Koch Industries)
- 6.4.7 BASF SE
- 6.4.8 FMC Corporation
- 6.4.9 SQM S.A.
- 6.4.10 Haifa Group
- 6.4.11 Compass Minerals International Inc.
- 6.4.12 Nouryon
- 6.4.13 Nufarm Limited
- 6.4.14 Brandt Consolidated Inc.
- 6.4.15 BMS Micro-Nutrients NV
7 KEY STRATEGIC QUESTIONS FOR FERTILIZER CEOS

