
PUBLISHER: Mordor Intelligence | PRODUCT CODE: 2062318

PUBLISHER: Mordor Intelligence | PRODUCT CODE: 2062318
E-Commerce Warehousing - Market Share Analysis, Industry Trends & Statistics, Growth Forecasts (2026 - 2031)
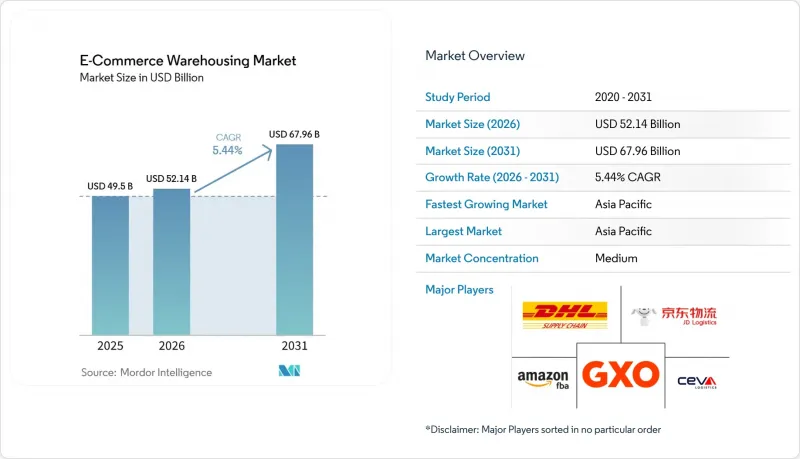
According to Mordor Intelligence, the global e-commerce warehousing market size is expected to increase from USD 49.50 billion in 2025 to USD 52.14 billion in 2026 and reach USD 67.96 billion by 2031, growing at a CAGR of 5.44% over 2026-2031.
A steady headline rate hides sweeping shifts as bonded facilities cluster around free-trade zones, direct-to-consumer (DTC) brands demand flexible pop-up capacity, and social-commerce-driven SKU volatility pushes operators toward adaptive automation. This report is Segmented by Warehouse Type (Fulfilment Centres, Distribution Centres, and More), by Service Type (Storage, Picking & Packing, and More), by Automation Level (Manual, Semi-Automated, and More), by End-User (Apparel & Footwear, Consumer Electronics, and More), and by Region (North America, South America, and More). The Market Forecasts are Provided in Terms of Value (USD).
Global E-Commerce Warehousing Market Trends and Insights
Cross-Border E-Commerce Surge Fuels Bonded-Warehouse Expansion
Free-trade zones from Jebel Ali to Singapore have raised bonded capacity by double-digit rates since 2024, enabling 3-5-day delivery to cross-border consumers and tipping the cost calculus for high-value goods. Chinese platforms such as Tmall Global funnel inventory through Southeast Asian bonded sites to shave two-week lead times, while European Union customs reforms reduced paperwork and unlocked 28% growth in Central-European bonded builds. These dynamics anchor the global e-commerce warehousing market's structural shift toward near-border storage nodes that flex with trade-lane swings.
Blockchain-Verified Chain-of-Custody Attracts Regulated Verticals
Pharmaceutical and luxury operators are migrating to third-party sites once verification gaps close. IBM Food Trust and comparable ledgers log every handling event, satisfying regulators and luxury houses that previously preferred in-house stockrooms. Vaccine programs from Pfizer to Moderna proved the model at scale, and fashion groups like LVMH now imprint QR-based provenance on warehouse exits. Immutable logs trim compliance overhead by 40% and automate insurance triggers, although enterprise deployments still run up to USD 2 million and suffer interoperability frictions. Even so, blockchain uptake signals fresh premium-service revenue inside the global e-commerce warehousing market.
Power-Grid Constraints Limit Automation Uptime in Emerging Regions
Intermittent electricity knocks robotic lines offline for 15-25% of scheduled hours in markets from India to Nigeria. Diesel backups raise costs by 35-40% and undermine ROI on AS/RS systems. JD Logistics saw Jakarta utilization tumble from 85% to 62% when voltage dipped, forcing hybrid solar-battery retrofits that add USD 100-150 per ft2 to capex. Until grid resilience improves, operators must balance automation ambition with localized power realities across the global e-commerce warehousing market.
Other drivers and restraints analyzed in the detailed report include:
- Direct-to-Consumer Brand Boom Drives Flexible Pop-Up Warehousing
- Social-Commerce-Led SKU Volatility Spurs Adaptive Storage Systems
- Escalating Cyber-Attacks on WMS Disrupt Fulfillment Continuity
For complete list of drivers and restraints, kindly check the Table Of Contents.
Segment Analysis
Micro-fulfillment centers and dark stores are expanding at a 10.68% CAGR (2026-2031), challenging traditional fulfillment centers, which still hold 43.42% of the global e-commerce warehousing market size in 2025. Their small, hyperlocal setups enable ultra-fast delivery, making them especially effective in dense urban areas.
Traditional distribution centers remain important but are evolving into omnichannel hubs. Cold-chain warehouses are also growing to support grocery and pharmaceutical demand, while bonded warehouses are gaining traction in cross-border e-commerce through duty-deferred models. At the same time, specialized facilities for returns and refurbishment are emerging, highlighting the rising importance of reverse logistics.
Storage held a 44.82% revenue of the global e-commerce warehousing market size in 2025, but value-added services will advance at a 10.15% CAGR as brands seek differentiation beyond plain shelving. Customized kitting, late-stage labeling, and bespoke packaging allow DTC sellers to embed brand equity at the warehouse touchpoint, commanding 15-25% price uplifts over basic pick-pack.
Rising returns are pushing warehouses to add inspection, refurbishment, and resale processes, making operations more complex. Fast-moving goods are increasingly handled through cross-docking to reduce storage time and costs. Meanwhile, strict tracking requirements in sectors like pharma and food are creating valuable, long-term service opportunities. Overall, warehousing is becoming more specialized and service-driven.
Geography Analysis
Asia-Pacific controlled 38.95% of the global e-commerce warehousing market share in 2025 and posts the strongest 6.08% CAGR through 2031. China's free-trade-zone network funnels USD 300 billion in cross-border goods through bonded depots, while Indonesia, Vietnam, and the Philippines add micro-fulfillment coverage to satisfy social-commerce flash demand. India's GST reform triggered a 40% jump in institutional-grade space and accelerated automation pilots despite power-grid inconsistencies. Japan and South Korea deploy robotics to offset aging labor pools, pushing regional technology intensity higher.
North America forms the second-largest slice of the global e-commerce warehousing market. Pandemic-era overbuilding left sublease space idle in 2024, yet absorption picked up in 2025 as retailers recalibrated omnichannel footprints. Mexico flourishes as a nearshore alternative, attracting bonded builds in Monterrey and Tijuana that knit into United States distribution corridors. Sustainability upgrades dominate United States capex, with rooftop solar and LEED Gold designs standard in new bids.
Europe records steady expansion behind Green Deal imperatives and BOPIS adoption. Warsaw and Rotterdam anchor multimodal corridors, while Brexit-driven customs frictions spark dual-inventory positions on each side of the Channel. LEED and BREEAM labels now influence financing terms, embedding efficiency baselines into continental warehouse valuations. Middle East and Africa, though smaller, grow rapidly; Dubai and Riyadh bankroll free-zone hubs to service tri-continent flows that feed the broader global e-commerce warehousing market.
- DHL Supply Chain & Fulfilment
- JD Logistics
- GXO Logistics
- CEVA Logistics
- UPS Supply Chain Solutions
- FedEx Supply Chain
- Maersk
- Kuehne+Nagel
- ShipBob
- Aramex
- Yusen Logistics
- Hellmann Worldwide Logistics
- SF Express
- Ninja Van
- Lineage Logistics
- DSV
- Geodis
- Nippon Express
- Sinotrans
- Ryder Supply Chain Solutions
Additional Benefits:
- The market estimate (ME) sheet in Excel format
- 3 months of analyst support
TABLE OF CONTENTS
1 Introduction
- 1.1 Study Assumptions & Market Definition
- 1.2 Scope of the Study
2 Research Methodology
3 Executive Summary
4 Market Landscape
- 4.1 Market Overview
- 4.2 Market Drivers
- 4.2.1 Cross-Border E-Commerce Surge Fuels Bonded-Warehouse Expansion
- 4.2.2 Blockchain-Verified Chain-of-Custody Attracts Regulated Verticals
- 4.2.3 Direct-To-Consumer Brand Boom Drives Flexible Pop-Up Warehousing
- 4.2.4 Social-Commerce-Led SKU Volatility Spurs Adaptive Storage Systems
- 4.2.5 Net-Zero Mandates Accelerate Investment in Energy-Positive Facilities
- 4.2.6 BOPIS Proliferation Requires Urban Omni-Inventory Hubs
- 4.3 Market Restraints
- 4.3.1 Power-Grid Constraints Limit Automation Uptime in Emerging Regions
- 4.3.2 Escalating Cyber-Attacks on WMS Disrupt Fulfillment Continuity
- 4.3.3 Urban-Edge Zoning Restrictions Delay Warehouse Approvals
- 4.3.4 Volatile Ocean-Freight Rates Complicate Inventory Positioning
- 4.4 Value / Supply-Chain Analysis
- 4.5 Regulatory Landscape
- 4.6 Technological Outlook
- 4.7 Porter's Five Forces
- 4.7.1 Competitive Rivalry
- 4.7.2 Threat of New Entrants
- 4.7.3 Bargaining Power of Suppliers
- 4.7.4 Bargaining Power of Buyers
- 4.7.5 Threat of Substitutes
5 Market Size & Growth Forecasts (Value, 2024-2030)
- 5.1 By Warehouse Type
- 5.1.1 Fulfilment Centres
- 5.1.2 Distribution Centres (DCs)
- 5.1.3 Cold-Chain Warehouses
- 5.1.4 Dark Stores / Micro-Fulfillment Centers
- 5.1.5 Others (reverse logistics hubs, bonded warehouses, hybrid-use spaces, etc.)
- 5.2 By Service Type
- 5.2.1 Storage
- 5.2.2 Picking & Packing
- 5.2.3 Value-Added Services and Others (kitting, labelling)
- 5.3 By Automation Level
- 5.3.1 Manual
- 5.3.2 Semi-Automated
- 5.3.3 Fully Automated
- 5.4 By End-User Industry
- 5.4.1 Apparel & Footwear
- 5.4.2 Consumer Electronics
- 5.4.3 Grocery & FMCG
- 5.4.4 Pharmaceuticals, Beauty & Wellness
- 5.4.5 Home Essentials & Furnishings
- 5.4.6 Others
- 5.5 By Geography
- 5.5.1 North America
- 5.5.1.1 United States
- 5.5.1.2 Canada
- 5.5.1.3 Mexico
- 5.5.2 South America
- 5.5.2.1 Brazil
- 5.5.2.2 Peru
- 5.5.2.3 Chile
- 5.5.2.4 Argentina
- 5.5.2.5 Rest of South America
- 5.5.3 Asia-Pacific
- 5.5.3.1 India
- 5.5.3.2 China
- 5.5.3.3 Japan
- 5.5.3.4 Australia
- 5.5.3.5 South Korea
- 5.5.3.6 South East Asia (Singapore, Malaysia, Thailand, Indonesia, Vietnam, and Philippines)
- 5.5.3.7 Rest of Asia-Pacific
- 5.5.4 Europe
- 5.5.4.1 United Kingdom
- 5.5.4.2 Germany
- 5.5.4.3 France
- 5.5.4.4 Spain
- 5.5.4.5 Italy
- 5.5.4.6 BENELUX (Belgium, Netherlands, and Luxembourg)
- 5.5.4.7 NORDICS (Denmark, Finland, Iceland, Norway, and Sweden)
- 5.5.4.8 Rest of Europe
- 5.5.5 Middle East and Africa
- 5.5.5.1 United Arab Emirates
- 5.5.5.2 Saudi Arabia
- 5.5.5.3 South Africa
- 5.5.5.4 Nigeria
- 5.5.5.5 Rest of Middle East And Africa
- 5.5.1 North America
6 Competitive Landscape
- 6.1 Market Concentration
- 6.2 Strategic Moves
- 6.3 Market Share Analysis
- 6.4 Company Profiles (includes Global level Overview, Market level overview, Core Segments, Financials as available, Strategic Information, Market Rank/Share for key companies, Products & Services, and Recent Developments)
- 6.4.1 DHL Supply Chain & Fulfilment
- 6.4.2 JD Logistics
- 6.4.3 GXO Logistics
- 6.4.4 CEVA Logistics
- 6.4.5 UPS Supply Chain Solutions
- 6.4.6 FedEx Supply Chain
- 6.4.7 Maersk
- 6.4.8 Kuehne+Nagel
- 6.4.9 ShipBob
- 6.4.10 Aramex
- 6.4.11 Yusen Logistics
- 6.4.12 Hellmann Worldwide Logistics
- 6.4.13 SF Express
- 6.4.14 Ninja Van
- 6.4.15 Lineage Logistics
- 6.4.16 DSV
- 6.4.17 Geodis
- 6.4.18 Nippon Express
- 6.4.19 Sinotrans
- 6.4.20 Ryder Supply Chain Solutions
7 Market Opportunities & Future Outlook

