
PUBLISHER: Mordor Intelligence | PRODUCT CODE: 2073610

PUBLISHER: Mordor Intelligence | PRODUCT CODE: 2073610
Europe Micronutrient Fertilizers - Market Share Analysis, Industry Trends & Statistics, Growth Forecasts (2026 - 2031)
The market's growth outlook is increasingly influenced by specialty micronutrients, with molybdenum projected to grow at a CAGR of 9.4% during 2026 to 2031, the highest among all product categories.
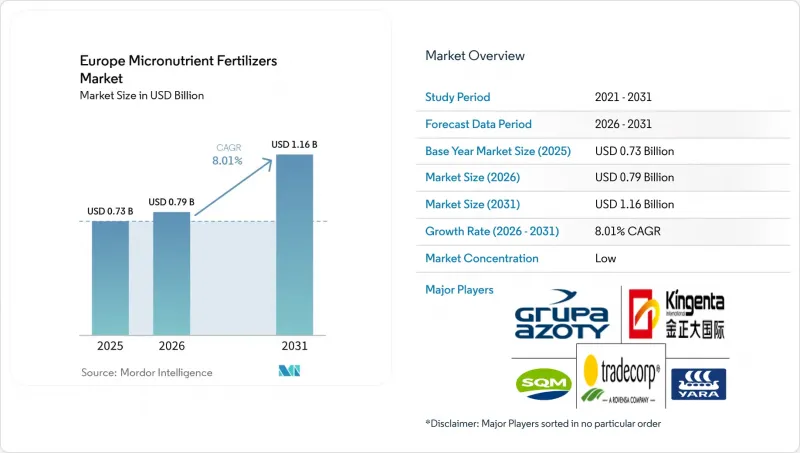
According to Mordor Intelligence, the europe micronutrient fertilizers market size was valued at USD 0.73 billion in 2025 and is estimated to reach USD 0.79 billion in 2026. This report is Segmented by Product (Boron, Copper, Iron, Manganese, Molybdenum, and More), by Application Mode (Fertigation, Foliar, and More), by Crop Type (Field Crops, Horticultural Crops, and More), and by Geography (France, Germany, Italy, Netherlands, Russia, Spain, Ukraine, United Kingdom, and More). The Market Forecasts are Provided in Terms of Value (USD) and Volume (Metric Tons).
Europe Micronutrient Fertilizers Market Trends and Insights
Precision-Agriculture Led Soil Micronutrient Mapping
Large European farms now operate GPS-guided sampling rigs that generate granular soil maps identifying pockets of zinc, iron, and manganese shortages long masked by blanket fertilization practices. Copernicus imagery adds seasonal moisture and vegetation indices, allowing agronomists to cross-check remote signals with physical samples. German equipment makers have commercialized spreaders that vary micronutrient rates every few meters, trimming over-application by up to 18% in pilot projects. As fields become data-rich, growers turn to chelated blends that stay available in alkaline zones and match prescription maps for each grid. Input distributors report that variable-rate programs convert into repeat orders because deficiencies re-emerge whenever farmers revert to uniform broadcasting. The technology therefore embeds micronutrients into precision-farming playbooks and pushes overall usage higher across the Europe micronutrient fertilizers market.
European Union Common Agricultural Policy Eco-Scheme Incentives
The 2023-2027 CAP earmarks EUR 48 billion (USD 52 billion) for eco-payments that reward documented nutrient-management plans, including micronutrient balance sheets. France and Germany reimburse growers EUR 60-80 per hectare (USD 65-87 per hectare) once soil-test data and application logs show optimum trace-element levels. These funds help small and medium-sized farms absorb the cost of laboratory tests, mobile sensors, and variable-rate controllers. Veterinary health agencies also back balanced fertilization because copper, zinc, and selenium deficiencies in forage crops can weaken livestock immunity. By bundling environmental compliance with farm-level productivity gains, the policy converts what was a voluntary practice into a mainstream agronomic obligation. Consequently, micronutrient suppliers see stable forward demand that is decoupled from commodity-price swings and better aligned with multi-year Common Agricultural Policy (CAP) budgets.
Metal-Based Raw-Material Price Volatility
Between January 2024 and September 2025, zinc oxide prices increased by 45%, while copper sulfate prices fluctuated by 20-30% per quarter, reflecting a tight mining supply and surging galvanizing demand. Fertilizer plants cannot hedge metals as easily as energy inputs because contract volumes are smaller and purity specs stricter, so spot market buying often drives finished-product quotes. Distributors facing unpredictable costs cut inventory and pass price spikes directly to growers, who may postpone non-essential micronutrient purchases. Some manufacturers negotiate multi-year offtake deals with smelters or turn to recycled metals, yet alloy by-product streams rarely meet agricultural purity thresholds. When commodity prices retrace, those producers stuck with high-cost stock must discount aggressively, eroding margins. Persistent volatility, therefore, adds a risk premium to retail prices and caps growth during short economic downturns across the Europe micronutrient fertilizers market.
Other drivers and restraints analyzed in the detailed report include:
- Rising Demand for High-Value Horticulture Crops
- Shift Toward Chelated Liquid and Water-Soluble Formulations
- Stringent European Union Limits on Heavy-Metal Contaminants
For complete list of drivers and restraints, kindly check the Table Of Contents.
Segment Analysis
Zinc accounted for 31.1% of the European micronutrient fertilizers market share in 2025, driven by its extensive application in cereal, oilseed, and maize production systems. These systems prioritize nutrient-use efficiency and yield optimization. The demand for zinc is further supported by the prevalence of zinc-deficient soils in parts of Central and Eastern Europe, alongside the growing adoption of balanced fertilization practices. Additionally, the increasing preference for chelated and water-soluble formulations is enhancing zinc's contribution to agricultural productivity across the region.
The rising cultivation of legumes and high-value horticultural crops is driving demand for molybdenum due to its critical role in nitrogen metabolism and crop productivity. Meanwhile, iron, copper, manganese, and boron continue to hold significant relevance across various crop systems. Manufacturers are also expanding their multi-nutrient and chelated product portfolios to enhance application efficiency and address evolving soil nutrient deficiencies in European agriculture.
Complete Report Scope:
- Product
- Boron
- Copper
- Iron
- Manganese
- Molybdenum
- Zinc
- Others
- Application Mode
- Fertigation
- Foliar
- Soil
- Crop Type
- Field Crops
- Horticultural Crops
- Turf and Ornamental
- By Geography
- France
- Germany
- Italy
- Netherlands
- Russia
- Spain
- Ukraine
- United Kingdom
- Rest of Europe
List of Companies Covered in this Report:
- Yara International ASA
- Compo Expert GmbH (Grupa Azoty S.A.)
- Kingenta Ecological Engineering Group Co., Ltd.
- Sociedad Quimica y Minera de Chile S.A.
- Trade Corporation International (Rovensa Group)
- BASF SE
- Compass Minerals International, Inc.
- Fertiberia, S.A. (Triton Partners)
- Haifa Chemicals Ltd. (Haifa Group)
- ICL Group Ltd.
- K+S Aktiengesellschaft
- Nutrien Ltd.
- Timac Agro SAS (Groupe Roullier)
- Valagro S.p.A. (Syngenta Group Co., Ltd.)
- Verdesian Life Sciences, LLC (AEA Investors)
Additional Benefits:
- The market estimate (ME) sheet in Excel format
- 3 months of analyst support
TABLE OF CONTENTS
1 Introduction
- 1.1 Study Assumptions and Market Definition
- 1.2 Scope of the Study
- 1.3 Research Methodology
2 Report offers
3 Executive Summary and Key Findings
4 Key Industries Trend
- 4.1 Acreage of Major Crop Types
- 4.1.1 Field Crops
- 4.1.2 Horticultural Crops
- 4.2 Average Nutrient Application Rates
- 4.2.1 Micronutrients
- 4.2.1.1 Field Crops
- 4.2.1.2 Horticultural Crops
- 4.2.1 Micronutrients
- 4.3 Agricultural Land Equipped For Irrigation
- 4.4 Regulatory Framework
- 4.5 Value Chain and Distribution Channel Analysis
- 4.6 Market Drivers
- 4.6.1 Precision-agriculture led soil micronutrient mapping
- 4.6.2 European Union Common Agricultural Policy eco-scheme incentives
- 4.6.3 Rising demand for high-value horticulture crops
- 4.6.4 Shift toward chelated liquid and water-soluble formulations
- 4.6.5 Digital agronomic advisory platforms boosting adoption
- 4.6.6 Post-Brexit fast-track micronutrient registrations in the UK
- 4.7 Market Restraints
- 4.7.1 Metal-based raw-material price volatility
- 4.7.2 Stringent European Union limits on heavy-metal contaminants
- 4.7.3 Bio-fortification policies reducing external application
- 4.7.4 Competition from biological inoculants and biofertilizers
5 Market Size and Growth Forecasts (Value and Volume)
- 5.1 Product
- 5.1.1 Boron
- 5.1.2 Copper
- 5.1.3 Iron
- 5.1.4 Manganese
- 5.1.5 Molybdenum
- 5.1.6 Zinc
- 5.1.7 Others
- 5.2 Application Mode
- 5.2.1 Fertigation
- 5.2.2 Foliar
- 5.2.3 Soil
- 5.3 Crop Type
- 5.3.1 Field Crops
- 5.3.2 Horticultural Crops
- 5.3.3 Turf and Ornamental
- 5.4 By Geography
- 5.4.1 France
- 5.4.2 Germany
- 5.4.3 Italy
- 5.4.4 Netherlands
- 5.4.5 Russia
- 5.4.6 Spain
- 5.4.7 Ukraine
- 5.4.8 United Kingdom
- 5.4.9 Rest of Europe
6 Competitive Landscape
- 6.1 Market Concentration
- 6.2 Strategic Moves
- 6.3 Market Share Analysis
- 6.4 Company Profiles (Includes Global Overview, Market Overview, Core Segments, Financials, Strategic Information, Market Rank/Share, Products and Services, and Recent Developments)
- 6.4.1 Yara International ASA
- 6.4.2 Compo Expert GmbH (Grupa Azoty S.A.)
- 6.4.3 Kingenta Ecological Engineering Group Co., Ltd.
- 6.4.4 Sociedad Quimica y Minera de Chile S.A.
- 6.4.5 Trade Corporation International (Rovensa Group)
- 6.4.6 BASF SE
- 6.4.7 Compass Minerals International, Inc.
- 6.4.8 Fertiberia, S.A. (Triton Partners)
- 6.4.9 Haifa Chemicals Ltd. (Haifa Group)
- 6.4.10 ICL Group Ltd.
- 6.4.11 K+S Aktiengesellschaft
- 6.4.12 Nutrien Ltd.
- 6.4.13 Timac Agro SAS (Groupe Roullier)
- 6.4.14 Valagro S.p.A. (Syngenta Group Co., Ltd.)
- 6.4.15 Verdesian Life Sciences, LLC (AEA Investors)
7 Key Strategic Questions for Fertilizer CEOs

