PUBLISHER: Mordor Intelligence | PRODUCT CODE: 2125276

PUBLISHER: Mordor Intelligence | PRODUCT CODE: 2125276
United Kingdom Mobile Payments - Market Share Analysis, Industry Trends & Statistics, Growth Forecasts (2026 - 2031)
According to Mordor Intelligence, the United Kingdom mobile payments market size was valued at USD 2.13 billion in 2025 and estimated to grow from USD 2.68 billion in 2026 to reach USD 8.49 billion by 2031, at a CAGR of 25.92% during the forecast period (2026-2031).
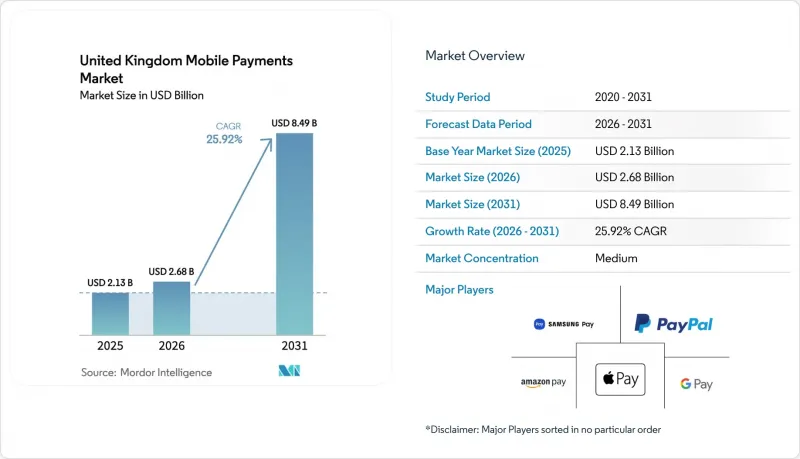
This report is Segmented by Payment Type (Proximity Payments, Remote Payments), Transaction Type (Peer-To-Peer (P2P), In-Store Point-Of-Sale (POS), Person-To-Merchant (P2M/Checkout), and More), Application (Retail & ECommerce, Transportation and Logistics, and More), End-User (Personal, Business), and Geography (United Kingdom). The Market Forecasts are Provided in Terms of Value (USD).
United Kingdom Mobile Payments Market Trends and Insights
Development of Open-Banking-Enabled Wallet Top-Ups
Open-banking payment volumes reached USD 57 billion in 2024 and are forecast to climb 209% by 2029, helped by a widening circle of application-programming-interface (API) standards and consumer familiarity with "pay-by-bank" buttons. Because the model removes card networks from the funding flow, merchants pay materially lower fees while customers enjoy the extra security of bank-grade authentication. The Financial Conduct Authority's ongoing work on VRP frameworks is accelerating product launches in which a wallet "pulls" funds straight from a user's account without additional credential entry. As of 2024, 13% of digitally active consumers and 18% of small businesses use an open-banking service at least once a month. Providers anticipate that real-time, multi-bank top-ups will become table-stakes functionality over the next two years, anchoring wallet loyalty and raising the United Kingdom mobile payments market's profile as a benchmark for embedded finance.
U.K. Faster Payments Scheme Accelerating P2P Adoption
The Faster Payments Scheme cleared GBP 3.7 trillion (USD 4.7 trillion) in account-to-account transfers during 2023, up 15% from 2022. Instant settlement transforms person-to-person cash flows, making it easier to split bills, gift money or settle rent within seconds. Visa's A2A overlay service, launched in 2025, brings chargeback-style dispute management and biometric confirmation to the scheme, making higher-ticket P2P transfers safer. For banks, the surge in low-cost, high-frequency traffic is a cross-sell gateway for deposits and unsecured credit, underlining why instant rails are now a board-level priority.
Interchange Fee Caps Squeezing PSP Margins
Debit and credit interchange fees have sat at 0.20% and 0.30% respectively since 2015, creating a margin squeeze for small and mid-tier payment service providers (PSPs). Card schemes have responded by raising non-regulated ancillary fees, adding an estimated GBP 170 million (USD 206 million) to UK merchants' cost of acceptance over seven years. Smaller PSPs without volume-based rebates face disproportionate drag and are accelerating toward consolidation or strategic partnerships. Consequently, many are pivoting to account-to-account propositions including Pay-by-Bank buttons to regain share of checkout.
Other drivers and restraints analyzed in the detailed report include:
- Surge in QR-Code Acceptance Among SME Merchants Across England
- Growing Wearable Payments on London Transport Network
- Rising APP Fraud Losses
For complete list of drivers and restraints, kindly check the Table Of Contents.
Segment Analysis
Proximity transactions accounted for 67.32% of the United Kingdom mobile payments market share in 2025, cementing contactless as the default tender at grocery checkouts, quick-service restaurants and mass-transit gates. Biometric authentication and token-on-file storage keep the fraud-to-sales ratio below card-not-present benchmarks. Remote payments, by contrast, are on track for a 30.12% CAGR, propelled by one-click "buy now" widgets in native apps and progressive-web-app checkout. Retailers are using remote wallets to merge cart abandonment-recovery emails, micro-loyalty incentives and seamless re-orders, blurring the once clear channel lines between physical and digital retail.
As the QR-code boom continues, the boundary between proximity and remote transactions grows increasingly porous. Consumers scan a code at the table, authenticate in their wallet, and the transaction settles remotely even though both parties are in the same venue. Such hybrid experiences further expand the total addressable United Kingdom mobile payments market size.
In-store POS claimed 59.25% of 2025 value. Visa's Tap-to-Phone solution, live on standard Android devices, delivered 320% volume growth within a year and onboarded thousands of micro-merchants that previously relied on cash only. The democratisation of acceptance allows small businesses florists, pop-up food stalls, home-repair contractors to plug into the digital economy without hardware subsidies.
P2P, advancing at 28.14% CAGR, is reshaping social payment etiquette. Instant refunds from split ride-hailing, rent settlements across flatmates and neighbourhood fundraisers all funnel increasing aggregate value through mobile apps. As biometric-secured P2P per-transaction limits rise, the segment will eat into higher-value transfers traditionally executed via desktop banking.
Complete Report Scope:
- By Payment Type
- Proximity Payments
- Remote Payments
- By Transaction Type
- Peer-to-Peer (P2P)
- In-store Point-of-Sale (POS)
- Person-to-Merchant (P2M/Checkout)
- Other Transaction Types
- By Application
- Retail & eCommerce
- Transportation and Logistics
- Hospitality & Food-Service
- Government & Public Sector
- Other Applications (Education, Healthcare)
- By End-user
- Personal
- Business
List of Companies Covered in this Report:
- Apple Inc. (Apple Pay)
- Google LLC (Google Pay)
- PayPal Holdings Inc.
- Samsung Electronics Co., Ltd. (Samsung Pay)
- Amazon.com, Inc. (Amazon Pay)
- Klarna Bank AB (publ)
- Barclays Bank UK PLC
- Mobile Payments Service Co. Ltd.
- Fitbit (LLC) (Fitbit Pay)
- BitPay Inc.
- Revolut Ltd
- Monzo Bank Ltd
- Starling Bank Limited
- Squareup International Ltd.
- Wise Payments Limited
- Worldpay (UK) Limited
- PayPoint plc
- Zettle by PayPal AB
- Checkout Ltd.
- Adyen N.V.
- Visa Inc.
- Mastercard Inc.
- Paysafe Group Holdings Ltd (Skrill/Neteller)
Additional Benefits:
- The market estimate (ME) sheet in Excel format
- 3 months of analyst support
TABLE OF CONTENTS
1 INTRODUCTION
- 1.1 Study Assumptions & Market Definition
- 1.2 Scope of the Study
2 RESEARCH METHODOLOGY
3 EXECUTIVE SUMMARY
4 MARKET LANDSCAPE
- 4.1 Market Overview
- 4.2 Market Drivers
- 4.2.1 Development of Open-Banking-Enabled Wallet Top-Ups
- 4.2.2 U.K. Faster Payments Scheme Accelerating P2P Adoption
- 4.2.3 Surge in QR-Code Acceptance Among SME Merchants Across England
- 4.2.4 Growing Wearable Payments on London Transport Network
- 4.2.5 Retailer-Led Super-App Ecosystems (e.g., Tesco Pay+)
- 4.2.6 BNPL-Integrated Wallets Driving Basket Conversion
- 4.3 Market Restraints
- 4.3.1 Interchange Fee Caps Squeezing PSP Margins
- 4.3.2 Rising APP (Authorised Push-Payment) Fraud Losses
- 4.3.3 Fragmented Wallet Loyalty-Point Interoperability
- 4.3.4 Demographic Payments Exclusion (55+ Age Cohort)
- 4.4 Value Chain Analysis
- 4.5 Regulatory Outlook
- 4.6 Technological Outlook
- 4.7 Porter's Five Forces
- 4.7.1 Bargaining Power of Suppliers
- 4.7.2 Bargaining Power of Buyers/Consumers
- 4.7.3 Threat of New Entrants
- 4.7.4 Threat of Substitutes
- 4.7.5 Intensity of Competitive Rivalry
- 4.8 Investment Analysis
- 4.9 Business-Model Analysis ( Super-App, PSP-Led, Telco-Led, FI-Led Models )
- 4.10 Mobile-Wallet Penetration Analysis
- 4.11 Commentary on M-Commerce Growth
- 4.12 Assessment of Macro Economic Trends on the Market
5 MARKET SIZE AND GROWTH FORECASTS (VALUES)
- 5.1 By Payment Type
- 5.1.1 Proximity Payments
- 5.1.2 Remote Payments
- 5.2 By Transaction Type
- 5.2.1 Peer-to-Peer (P2P)
- 5.2.2 In-store Point-of-Sale (POS)
- 5.2.3 Person-to-Merchant (P2M/Checkout)
- 5.2.4 Other Transaction Types
- 5.3 By Application
- 5.3.1 Retail & eCommerce
- 5.3.2 Transportation and Logistics
- 5.3.3 Hospitality & Food-Service
- 5.3.4 Government & Public Sector
- 5.3.5 Other Applications (Education, Healthcare)
- 5.4 By End-user
- 5.4.1 Personal
- 5.4.2 Business
6 COMPETITIVE LANDSCAPE
- 6.1 Market Concentration
- 6.2 Strategic Moves
- 6.3 Market Share Analysis
- 6.4 Company Profiles (includes Global-Level Overview, Market-Level Overview, Core Segments, Financials as available, Strategic Information, Market Rank/Share, Products & Services, Recent Developments)
- 6.4.1 Apple Inc. (Apple Pay)
- 6.4.2 Google LLC (Google Pay)
- 6.4.3 PayPal Holdings Inc.
- 6.4.4 Samsung Electronics Co., Ltd. (Samsung Pay)
- 6.4.5 Amazon.com, Inc. (Amazon Pay)
- 6.4.6 Klarna Bank AB (publ)
- 6.4.7 Barclays Bank UK PLC
- 6.4.8 Mobile Payments Service Co. Ltd.
- 6.4.9 Fitbit (LLC) (Fitbit Pay)
- 6.4.10 BitPay Inc.
- 6.4.11 Revolut Ltd
- 6.4.12 Monzo Bank Ltd
- 6.4.13 Starling Bank Limited
- 6.4.14 Squareup International Ltd.
- 6.4.15 Wise Payments Limited
- 6.4.16 Worldpay (UK) Limited
- 6.4.17 PayPoint plc
- 6.4.18 Zettle by PayPal AB
- 6.4.19 Checkout Ltd.
- 6.4.20 Adyen N.V.
- 6.4.21 Visa Inc.
- 6.4.22 Mastercard Inc.
- 6.4.23 Paysafe Group Holdings Ltd (Skrill/Neteller)
7 MARKET OPPORTUNITIES AND FUTURE OUTLOOK
- 7.1 White-Space & Unmet-Need Assessment

