PUBLISHER: Mordor Intelligence | PRODUCT CODE: 2125408

PUBLISHER: Mordor Intelligence | PRODUCT CODE: 2125408
India E-commerce Logistics - Market Share Analysis, Industry Trends & Statistics, Growth Forecasts (2026 - 2031)
According to Mordor Intelligence, the India e-commerce logistics market size was valued at USD 6.65 billion in 2025 and estimated to grow from USD 7.25 billion in 2026 to reach USD 11.14 billion by 2031, at a CAGR of 8.98% during the forecast period (2026-2031).
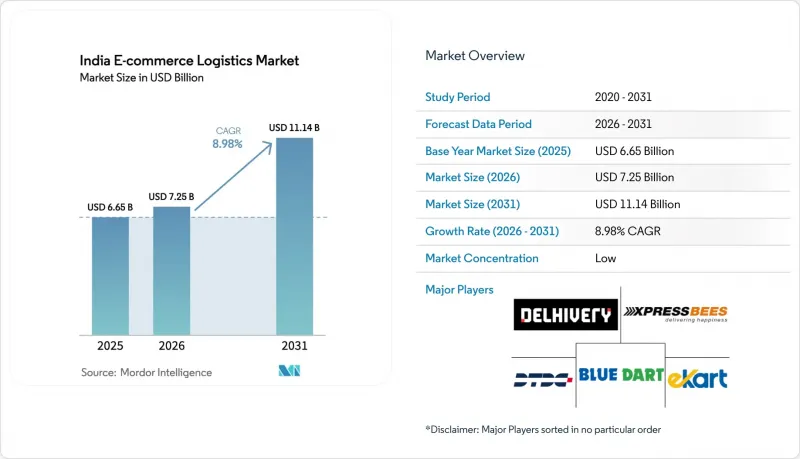
This report is Segmented by Service (Transportation, Warehousing & Fulfilment, and Value-Added Services), Business Model (B2C, B2B, and C2C), Destination (Domestic and Cross-Border), Delivery Speed (Same-Day, and More), Product Category (Foods & Beverages, and More), City Tier (Tier 1, 2, and More), and Region (North, South, and More). Market Forecasts are Provided in Terms of Value (USD).
India E-commerce Logistics Market Trends and Insights
ONDC-Driven MSME Onboarding
ONDC removes platform silos, enabling logistics firms to serve multiple seller ecosystems through standardized APIs that cut integration costs and elevate asset utilization. The model especially benefits tier 2 and tier 3 markets where traditional e-commerce reach was limited, spurring fresh revenue channels while forcing incumbents to compete on transparency and service quality. Transaction volumes on ONDC have scaled nationwide, confirming its role in democratizing logistics access.
D2C Brand Proliferation
Direct-to-consumer labels demand integrated inventory management, personalized packaging, and agile returns, pushing providers to invest in automation and predictive analytics. SKU proliferation coupled with seasonal surges raises complexity, yet the premium on consumer experience allows higher margins through specialized value-added services. This trend strengthens the adoption of warehouse management systems that synchronize multi-node fulfillment and support differentiated pricing.
Sub-Optimal Rural Road & Warehousing Infrastructure
Connectivity gaps increase per-shipment costs and elongate delivery windows in rural markets. Warehousing shortages restrict temperature-sensitive and bulky product categories, limiting SKU variety. Government road initiatives continue to narrow the gap, yet infrastructure development trails e-commerce demand. Reverse logistics complexities further raise costs where transport options remain sparse.
Other drivers and restraints analyzed in the detailed report include:
- Same-Day / Quick-Commerce Boom
- UPI and Digital-Payments Ubiquity
- High Product-Return / COD Ratio
For complete list of drivers and restraints, kindly check the Table Of Contents.
Segment Analysis
Transportation generated 71.42% of the India e-commerce logistics market share in 2025, and the Value-Added Services segment CAGR stands at 7.11% to 2031. Providers offering branded packaging, kitting, and inspection enjoy strong pricing power. Transportation faces commoditization, but road haulage still offers the volume backbone for the India e-commerce logistics market. Rail improvements shorten transit times for bulk shipments, and air freight remains critical for time-sensitive cross-border parcels.
Technology-driven automation in warehousing cuts error rates and supports scale, while AI-enabled quality control allows providers to expand without proportional cost escalation. These capabilities sustain customer-retention strategies and create competitive barriers.
The B2C segment contributed 62.58% to the India e-commerce logistics market size in 2025 and continues to set service-level benchmarks. The C2C corridor, propelled by social-commerce activity, is advancing at a 6.42% CAGR (2026-2031) and demands professional tracking, insurance, and support for individual entrepreneurs. B2B shipments offer stability but yield lower technology differentiation opportunities.
B2C growth aligns with rising quick-commerce expectations and widespread smartphone adoption, compelling providers to refine last-mile networks and customer-communication tools. Social-commerce expansion amplifies the need for scalable micro-fulfillment solutions that meet individualized seller requirements.
Complete Report Scope:
- By Service
- Transportation
- Road
- Rail
- Air
- Sea
- Warehousing & Fulfilment
- Value-Added Services (Labelling, Packaging, Kitting)
- Transportation
- By Business Model
- B2C
- B2B
- C2C
- By Destination
- Domestic
- Cross-border (international)
- By Delivery Speed
- Same-day (less than 24 h)
- Next-day (24-48 h)
- Standard (3-5 days)
- Others (more than 5 days)
- By Product Category
- Foods & Beverages
- Personal & Household Care
- Fashion & Lifestyle (accessories, apparel, footwear)
- Furniture
- Consumer Electronics & Household Appliances
- Other Products
- By City Tier
- Tier 1
- Tier 2
- Tier 3 and Below
- By Region (India)
- North
- South
- East
- West
- Central
List of Companies Covered in this Report:
- Delhivery
- Ekart Logistics
- XpressBees
- Blue Dart Express
- DTDC
- TVS Supply Chain Solutions
- FedEx India
- DHL Express India
- Gati-KWE
- Shadowfax
- Mahindra Logistics
- Shiprocket
- Wow Express
- Pickrr
- AAJ Supply Chain Management
- ARK India
- Borzo
- NimbusPost
- Godamwale
- Emiza
Additional Benefits:
- The market estimate (ME) sheet in Excel format
- 3 months of analyst support
TABLE OF CONTENTS
1 Introduction
- 1.1 Study Assumptions & Market Definition
- 1.2 Scope of the Study
2 Research Methodology
3 Executive Summary
4 Market Landscape
- 4.1 Market Overview
- 4.2 Market Drivers
- 4.2.1 ONDC-driven MSME onboarding
- 4.2.2 D2C brand proliferation
- 4.2.3 Same-day/quick-commerce boom (hyperlocal fulfilment)
- 4.2.4 UPI & digital-payments ubiquity
- 4.2.5 Rail-based express cargo corridors (Gati Shakti, DFC)
- 4.2.6 Growth of social-commerce platforms
- 4.3 Market Restraints
- 4.3.1 Sub-optimal rural road & warehousing infra
- 4.3.2 High product-return / COD ratio
- 4.3.3 Draft e-commerce rules & data-localisation costs
- 4.3.4 Stricter ESG & decarbonisation compliance
- 4.4 Value / Supply-Chain Analysis
- 4.5 Regulatory Landscape
- 4.6 Technological Outlook
- 4.7 Demand & Supply Analysis
- 4.8 Industry Attractiveness - Porter's Five Forces
- 4.8.1 Threat of New Entrants
- 4.8.2 Bargaining Power of Buyers
- 4.8.3 Bargaining Power of Suppliers
- 4.8.4 Threat of Substitutes
- 4.8.5 Competitive Rivalry
- 4.9 Impact of Geo-Political Events on Supply Chain Shifts
- 4.10 Reverse / Return Logistics Insights
5 Market Size & Growth Forecasts
- 5.1 By Service
- 5.1.1 Transportation
- 5.1.1.1 Road
- 5.1.1.2 Rail
- 5.1.1.3 Air
- 5.1.1.4 Sea
- 5.1.2 Warehousing & Fulfilment
- 5.1.3 Value-Added Services (Labelling, Packaging, Kitting)
- 5.1.1 Transportation
- 5.2 By Business Model
- 5.2.1 B2C
- 5.2.2 B2B
- 5.2.3 C2C
- 5.3 By Destination
- 5.3.1 Domestic
- 5.3.2 Cross-border (international)
- 5.4 By Delivery Speed
- 5.4.1 Same-day (less than 24 h)
- 5.4.2 Next-day (24-48 h)
- 5.4.3 Standard (3-5 days)
- 5.4.4 Others (more than 5 days)
- 5.5 By Product Category
- 5.5.1 Foods & Beverages
- 5.5.2 Personal & Household Care
- 5.5.3 Fashion & Lifestyle (accessories, apparel, footwear)
- 5.5.4 Furniture
- 5.5.5 Consumer Electronics & Household Appliances
- 5.5.6 Other Products
- 5.6 By City Tier
- 5.6.1 Tier 1
- 5.6.2 Tier 2
- 5.6.3 Tier 3 and Below
- 5.7 By Region (India)
- 5.7.1 North
- 5.7.2 South
- 5.7.3 East
- 5.7.4 West
- 5.7.5 Central
6 Competitive Landscape
- 6.1 Market Concentration
- 6.2 Strategic Moves
- 6.3 Market Share Analysis
- 6.4 Company Profiles (includes Global level Overview, Market level overview, Core Segments, Financials as available, Strategic Information, Market Rank/Share for key companies, Products & Services, and Recent Developments)
- 6.4.1 Delhivery
- 6.4.2 Ekart Logistics
- 6.4.3 XpressBees
- 6.4.4 Blue Dart Express
- 6.4.5 DTDC
- 6.4.6 TVS Supply Chain Solutions
- 6.4.7 FedEx India
- 6.4.8 DHL Express India
- 6.4.9 Gati-KWE
- 6.4.10 Shadowfax
- 6.4.11 Mahindra Logistics
- 6.4.12 Shiprocket
- 6.4.13 Wow Express
- 6.4.14 Pickrr
- 6.4.15 AAJ Supply Chain Management
- 6.4.16 ARK India
- 6.4.17 Borzo
- 6.4.18 NimbusPost
- 6.4.19 Godamwale
- 6.4.20 Emiza
7 Market Opportunities & Future Outlook
- 7.1 White-space & Unmet-need Assessment
8 Appendix
- 8.1 Macroeconomic Indicators
- 8.2 Capital-flow Insights
- 8.3 E-commerce & Consumer-spend Statistics
- 8.4 External Trade Statistics

