
PUBLISHER: Global Market Insights Inc. | PRODUCT CODE: 1892859

PUBLISHER: Global Market Insights Inc. | PRODUCT CODE: 1892859
North America Used Cars Market Opportunity, Growth Drivers, Industry Trend Analysis, and Forecast 2026 - 2035
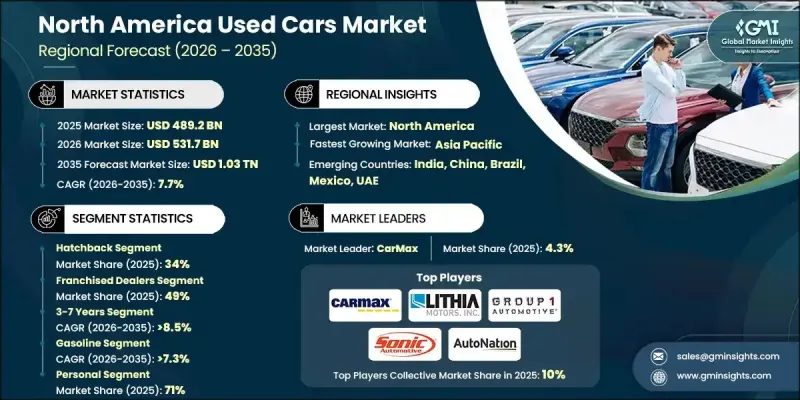
North America Used Cars Market was valued at USD 489.2 billion in 2025 and is estimated to grow at a CAGR of 7.7% to reach USD 1.03 trillion by 2035.
The widening affordability gap between new and used vehicles continues to push more shoppers toward pre-owned options across the region. Growing adoption of certified programs is easing concerns about vehicle condition, past ownership, and mechanical reliability through standardized inspections, transparent history reports, and extended warranty coverage. These programs allow retailers to improve turnover rates and generate healthier margins while earning buyer confidence. Digital retailing and data-driven tools are reshaping pricing, sourcing, and personalization, with advanced analytics expected to influence inventory and customer targeting over the next several years. Market volatility created by fluctuating wholesale values has tightened dealer margins, making faster reconditioning and diversified procurement strategies increasingly essential. Supply patterns are still adjusting as three-year returns remain lower than historical norms, keeping late-model resale prices firmer than anticipated. Enhanced omnichannel systems, stronger logistics, and algorithmic pricing models continue to accelerate the pace of transactions and make the used car ecosystem more efficient across North America.
| Market Scope | |
|---|---|
| Start Year | 2025 |
| Forecast Year | 2026-2035 |
| Start Value | $489.2 Billion |
| Forecast Value | $1.03 Trillion |
| CAGR | 7.7% |
The franchised dealer segment held a 49% share in 2025 and is projected to grow at a CAGR of 7.7% from 2026 to 2035. Their dominance in higher-value, newer vehicle transactions comes from close OEM ties, priority access to lease returns, and widespread availability of certified programs. Omnichannel tools now allow shoppers to complete major steps-financing, valuation, and scheduling-before visiting a location, narrowing the gap between digital and physical retail. Peer-to-peer platforms represent the fastest-rising channel, appealing to buyers seeking lower prices, with platforms adding verification tools to reduce risk. Independent dealers continue serving older vehicles and customers who rely on flexible in-house financing options.
The 3-7-year segment held a 41% share in 2025 and is set to grow at a CAGR of 8.5% through 2035. Vehicles in this age range provide updated technology and safety capabilities without the steep depreciation experienced in the first few years. Retaining approximately 40-60% of their original value, they offer a strong balance of affordability and reliability, with many models still supported by limited warranties.
U.S. Used Cars Market held a 97% share and generated USD 475.2 billion in 2025. Buyer preferences differ notably across the country, with Southern and Western regions showing strong demand for trucks and SUVs due to lifestyle and commercial needs, while Northeastern areas lean toward sedans and compact vehicles because of dense cities, higher fuel costs, and limited parking.
Key companies in the North America Used Cars Market include AutoNation, CarMax, Carvana, Group 1 Automotive, Hendrick Automotive Group, Holman, Ken Garff, Larry H. Miller, Lithia Motors, Penske Automotive Group, and Sonic Automotive. Leading companies in the North America Used Cars Market are strengthening their position by expanding omnichannel retail frameworks that merge digital convenience with in-store efficiency. Many dealers are investing in AI-based pricing models to optimize valuations and react quickly to market shifts. Accelerated reconditioning processes and improved logistics systems are enabling faster inventory cycles and higher profitability. Firms are also broadening sourcing tactics through partnerships, closed auctions, and direct-to-consumer acquisition programs to secure a consistent supply.
Table of Contents
Chapter 1 Methodology
- 1.1 Market scope and definition
- 1.2 Research design
- 1.2.1 Research approach
- 1.2.2 Data collection methods
- 1.3 Data mining sources
- 1.3.1 Global
- 1.3.2 Regional/Country
- 1.4 Base estimates and calculations
- 1.4.1 Base year calculation
- 1.4.2 Key trends for market estimation
- 1.5 Primary research and validation
- 1.5.1 Primary sources
- 1.6 Forecast model
- 1.7 Research assumptions and limitations
Chapter 2 Executive Summary
- 2.1 Industry 3600 synopsis, 2022 - 2035
- 2.2 Key market trends
- 2.2.1 Regional
- 2.2.2 Vehicle
- 2.2.3 Sales Channel
- 2.2.4 Vehicle age
- 2.2.5 Fuel
- 2.2.6 End use
- 2.2.7 Price range
- 2.3 TAM Analysis, 2026-2035
- 2.4 CXO perspectives: Strategic imperatives
- 2.4.1 Executive decision points
- 2.4.2 Critical success factors
- 2.5 Future outlook and strategic recommendations
Chapter 3 Industry Insights
- 3.1 Industry ecosystem analysis
- 3.1.1 Supplier landscape
- 3.1.2 Profit margin analysis
- 3.1.3 Cost structure
- 3.1.4 Value addition at each stage
- 3.1.5 Factor affecting the value chain
- 3.1.6 Disruptions
- 3.2 Industry impact forces
- 3.2.1 Growth drivers
- 3.2.1.1 Digital Transformation & Consumer Convenience
- 3.2.1.2 CPO Program Expansion & Consumer Confidence
- 3.2.1.3 EV Adoption in Used Market
- 3.2.1.4 Cross-Border Trade Growth
- 3.2.2 Industry pitfalls & challenges
- 3.2.2.1 Pricing Volatility & Affordability Challenges
- 3.2.2.2 Regulatory Compliance Burden
- 3.2.2.3 Consumer Trust & Fraud Concerns
- 3.2.3 Market opportunities
- 3.2.3.1 Underserved Buyer Segments
- 3.2.3.2 Geographic Expansion
- 3.2.3.3 Commercial Fleet & Ride-Sharing Segment
- 3.2.3.4 Independent Dealer Competitive Positioning
- 3.2.1 Growth drivers
- 3.3 Growth potential analysis
- 3.4 Regulatory landscape
- 3.4.1 US
- 3.4.2 Canada
- 3.5 Porter's analysis
- 3.6 PESTEL analysis
- 3.7 Technology and Innovation landscape
- 3.7.1 Current technological trends
- 3.7.2 Emerging technologies
- 3.8 Price trends
- 3.8.1 By region
- 3.8.2 By Products
- 3.9 Cost breakdown analysis
- 3.10 Patent analysis
- 3.11 Sustainability and environmental aspects
- 3.11.1 Sustainable practices
- 3.11.2 Waste reduction strategies
- 3.11.3 Energy efficiency in production
- 3.11.4 Eco-friendly initiatives
- 3.11.5 Carbon footprint considerations
- 3.11.6 Market Maturity & Adoption Analysis
- 3.12 Digital transformation landscape
- 3.12.1 Traditional vs digital channel evolution
- 3.12.2 Technology integration trends
- 3.12.3 Digital platform business models
- 3.12.4 Mobile commerce adoption
- 3.12.5 Consumer behavior analysis
- 3.12.6 Regional consumer preferences
- 3.12.7 Demographic segmentation
- 3.12.7.1 Age group preferences
- 3.12.7.2 Income level correlations
- 3.12.7.3 Urban vs rural differences
- 3.12.7.4 Gender-based preferences
- 3.12.8 Digital adoption patterns
- 3.13 Electric vehicle impact on used car market
- 3.13.1 EV adoption trends
- 3.13.2 Used EV market challenges
- 3.13.3 ICE vehicle residual value impact
- 3.13.4 Market transition dynamics
- 3.14 Financing and investment landscape
- 3.14.1 Traditional financing channels
- 3.14.2 Digital financing innovation
- 3.14.3 Credit assessment and risk management
- 3.15 Investment trends and funding
- 3.15.1 Venture capital investment
- 3.15.2 Private equity involvement
- 3.15.3 Strategic partnerships
Chapter 4 Competitive Landscape, 2025
- 4.1 Introduction
- 4.2 Company market share analysis
- 4.2.1 US
- 4.2.2 Canada
- 4.3 Competitive analysis of major market players
- 4.4 Competitive positioning matrix
- 4.5 Strategic outlook matrix
- 4.6 Key developments
- 4.6.1 Mergers & acquisitions
- 4.6.2 Partnerships & collaborations
- 4.6.3 New Product Launches
- 4.6.4 Expansion Plans and funding
Chapter 5 Market Estimates & Forecast, By Vehicle, 2022 - 2035 ($Bn, Units)
- 5.1 Key trends
- 5.2 Hatchback
- 5.3 Sedan
- 5.4 SUV
Chapter 6 Market Estimates & Forecast, By Sales Channel, 2022 - 2035 ($Bn, Units)
- 6.1 Key trends
- 6.2 Peer-to-peer
- 6.3 Franchised dealers
- 6.4 Independent dealers
Chapter 7 Market Estimates & Forecast, By Vehicle Age, 2022 - 2035 ($Bn, Units)
- 7.1 Key trends
- 7.2 0-3 years
- 7.3 3-7 years
- 7.4 Above 7 years
Chapter 8 Market Estimates & Forecast, By Fuel, 2022 - 2035 ($Bn, Units)
- 8.1 Key trends
- 8.2 Gasoline
- 8.3 Diesel
- 8.4 Electric
- 8.4.1 BEV
- 8.4.2 PHEV
- 8.4.3 HEV
- 8.4.4 FCEV
Chapter 9 Market Estimates & Forecast, By End Use, 2022 - 2035 ($Bn, Units)
- 9.1 Key trends
- 9.2 Personal
- 9.3 Commercial
Chapter 10 Market Estimates & Forecast, By Price Range, 2022 - 2035 ($Bn, Units)
- 10.1 Key trends
- 10.2 Under USD 7,000
- 10.3 USD 7000-USD 10,000
- 10.4 USD 10,000-15,000
- 10.5 Above USD 15,000
Chapter 11 Market Estimates & Forecast, By Region, 2022 - 2035 ($Bn, Units)
- 11.1 Key trends
- 11.2 US
- 11.2.1 Northeast
- 11.2.1.1 New Jersey
- 11.2.1.2 New York
- 11.2.1.3 Pennsylvania
- 11.2.1.4 New England
- 11.2.2 Midwest
- 11.2.2.1 Illinois
- 11.2.2.2 Indiana
- 11.2.2.3 Michigan
- 11.2.2.4 Ohio
- 11.2.2.5 Missouri
- 11.2.2.6 Nebraska
- 11.2.2.7 North Dakota
- 11.2.2.8 South Dakota
- 11.2.3 South
- 11.2.3.1 Delaware
- 11.2.3.2 Florida
- 11.2.3.3 Georgia
- 11.2.3.4 Maryland
- 11.2.3.5 North Carolina
- 11.2.3.6 South Carolina
- 11.2.4 West
- 11.2.4.1 Arizona
- 11.2.4.2 Colorado
- 11.2.4.3 Montana
- 11.2.4.4 Alaska
- 11.2.4.5 California
- 11.2.1 Northeast
- 11.3 Canada
- 11.3.1 Ontario
- 11.3.2 Quebec
- 11.3.3 British Columbia
- 11.3.4 Alberta
- 11.3.5 Manitoba
Chapter 12 Company Profiles
- 12.1 Used Car Dealers/Retailers
- 12.1.1 Asbury Automotive Group
- 12.1.2 AutoNation
- 12.1.3 CarMax
- 12.1.4 Carvana
- 12.1.5 Findlay
- 12.1.6 Group 1 Automotive
- 12.1.7 Hendrick Automotive Group
- 12.1.8 Holman
- 12.1.9 Ken Garff
- 12.1.10 Larry H. Miller
- 12.1.11 Lithia Motors
- 12.1.12 Morgan
- 12.1.13 Penske Automotive Group
- 12.1.14 Sonic Automotive
- 12.2 Online Marketplaces/Platforms
- 12.2.1 Autotrader
- 12.2.2 AutoTrader.ca
- 12.2.3 CarGurus
- 12.2.4 Cars.com
- 12.3 Automotive Manufacturers
- 12.3.1 BMW
- 12.3.2 Ford
- 12.3.3 General Motors (GM)
- 12.3.4 Honda
- 12.3.5 Jaguar
- 12.3.6 Lexus
- 12.3.7 Mercedes-Benz
- 12.3.8 Nissan
- 12.3.9 Porsche
- 12.3.10 Toyota

