PUBLISHER: Mordor Intelligence | PRODUCT CODE: 2125487

PUBLISHER: Mordor Intelligence | PRODUCT CODE: 2125487
Industrial Static Equipment - Market Share Analysis, Industry Trends & Statistics, Growth Forecasts (2026 - 2031)
According to Mordor Intelligence, the industrial static equipment market size was valued at USD 179.6 billion in 2025 and estimated to grow from USD 187.47 billion in 2026 to reach USD 232.3 billion by 2031, at a CAGR of 4.38% during the forecast period (2026-2031).
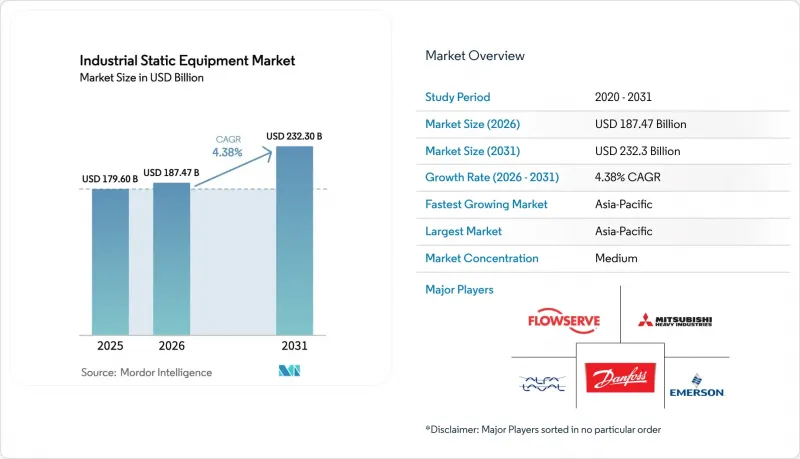
This report is Segmented by Equipment Type (Valves, Furnaces/Boilers, Heat Exchangers, and More), Material of Construction (Carbon Steel, Stainless Steel, Alloy Steel, and Non-Ferrous and Composites), Pressure Rating (Low, Medium, and High), End-User Industry (Oil and Gas, Power Generation, Water and Wastewater, and More), and Geography. The Market Forecasts are Provided in Terms of Value (USD).
Global Industrial Static Equipment Market Trends and Insights
Rapid Industrialization Across Emerging Economies
Manufacturing output in China climbed 6.2% during 2024 while India's industrial production grew 5.8% year-over-year, accelerating build-outs of petrochemical complexes, steel plants, and renewable hydrogen hubs that each need valves, pressure vessels, and heat exchangers. Several Gulf nations also committed more than USD 20 billion to hydrogen megaprojects, driving initial demand for high-pressure static assets. These economies frequently require entire greenfield installations rather than incremental replacements, resulting in large multi-equipment orders that lift the industrial static equipment market. Government-backed industrial corridors and foreign direct investment programs ensure capacity additions extend well into the forecast window, maintaining a positive demand trajectory.
Expansion of Upstream Oil and Gas and LNG Infrastructure
Global LNG liquefaction capacity additions totaled 42 million tpa in 2024, supported by projects in Qatar, the United States, and Australia that mandate cryogenic valves and custom heat exchangers. Upstream capital expenditure rebounded to USD 525 billion, setting the stage for sustained equipment orders tied to long-lead offshore platforms, gathering systems, and gas-processing plants. Suppliers with proven sour-gas, high-temperature, and subsea qualifications gain preferred-vendor status, reinforcing recurring revenue across multi-decade project lifecycles.
High Capital Cost and Shift Toward Renewable Generation
Renewables accounted for 85% of global new-build power capacity in 2024, suppressing boiler and furnace orders tied to fossil assets. Simultaneously, elevated interest rates raise hurdle rates for cap-ex-heavy static equipment packages that routinely eclipse USD 50 million per installation. Investors prefer low-carbon or flexible assets, delaying traditional thermal projects and trimming near-term order books for large-diameter vessels and high-capacity heat-recovery systems.
Other drivers and restraints analyzed in the detailed report include:
- Capacity Additions in Chemicals and Petrochemicals
- Stricter Emission Norms Driving Heat-Transfer Retrofits
- Volatile Prices of Special-Grade Steel and Alloys
For complete list of drivers and restraints, kindly check the Table Of Contents.
Segment Analysis
Valves generated the largest portion of the industrial static equipment market size, contributing 32.86% of 2025 revenue as their omnipresence spans isolation, regulation, and safety functions across every process. Their relatively short five-to-seven-year replacement cycles and multiplicity within a single plant drive high unit volumes. The industrial static equipment market share for heat exchangers, though smaller, is rising swiftly; mandated efficiency retrofits lift exchanger sales at a 5.65% CAGR through 2031. Manufacturers are embedding sensors and antifouling coatings to boost uptime and energy recovery.
Furnaces and boilers continue to register dependable orders from waste-to-energy and district-heating projects, even as coal retirements continue. Pressure vessels, while low in volume, command premium prices owing to custom engineering, stringent code compliance, and extended fabrication schedules that stretch up to 18 months. Digital integration is now ubiquitous: smart valves relay stem friction and seating integrity, while exchanger arrays transmit fouling coefficients in real time, enabling predictive maintenance strategies that shrink operating expenditure.
Carbon steel remained the cost-effective workhorse with 37.40% revenue share in 2025, meeting general service needs in water, HVAC, and moderate-temperature processing lines. Alloy steel, however, is gaining traction as refineries, petrochemical crackers, and combined-cycle plants push temperatures and pressures higher, giving the segment a 5.78% CAGR. Operators increasingly weigh total lifecycle expense, recognizing that superior alloys can cut unscheduled downtime and reduce corrosion-related failures, thereby trimming warranty claims and insurance premiums linked to critical-path outages.
Stainless steel occupies a balanced middle ground, prized in food, beverage, and pharmaceuticals, where product purity is paramount. Non-ferrous and composite materials claim a niche yet expanding foothold; titanium heat exchangers, for example, are preferred in coastal cooling-water service despite prices up to eight times higher than stainless alternatives. Composite shells for atmospheric tanks are also seeing uptake in corrosive chemical storage, underscoring material innovation's role in broadening supplier portfolios.
Complete Report Scope:
- By Equipment Type
- Valves
- Gate, Globe and Check
- Ball Valves
- Butterfly Valves
- Plug Valves
- Pressure-relief Valves
- Furnaces / Boilers
- Heat Exchangers
- Pressure Vessels
- Valves
- By Material of Construction
- Carbon Steel
- Stainless Steel
- Alloy Steel
- Non-ferrous and Composites
- By Pressure Rating
- Low (< 300 psi)
- Medium (300-900 psi)
- High (> 900 psi)
- By End-user Industry
- Oil and Gas
- Power Generation
- Chemicals and Petrochemicals
- Water and Wastewater
- Mining and Metals
- Food and Beverages
- Other End-user Industry
- By Geography
- North America
- United States
- Canada
- Mexico
- Europe
- Germany
- United Kingdom
- France
- Russia
- Rest of Europe
- Asia-Pacific
- China
- Japan
- India
- South Korea
- Australia
- Rest of Asia-Pacific
- Middle East and Africa
- Middle East
- Saudi Arabia
- United Arab Emirates
- Rest of Middle East
- Africa
- South Africa
- Egypt
- Rest of Africa
- Middle East
- South America
- Brazil
- Argentina
- Rest of South America
- North America
Geography Analysis
Asia-Pacific retained 42.10% of global revenue in 2025, underpinned by a near-constant pipeline of refinery expansions, coal-to-chemicals plants, and state-backed infrastructure corridors. The industrial static equipment market size across China and India continues its upward trajectory as petrochemical output, steel production, and grid-scale storage facilities come online. Japan and South Korea contribute high-margin orders for precision alloy exchangers and specialty valves that meet stringent quality norms, while Southeast Asian nations absorb mainstream carbon-steel equipment as manufacturing shifts southward.
North America ranks next, anchored by shale gas development and a pronounced push toward petrochemical feedstock integration. The United States leads in LNG export capacity, necessitating cryogenic pressure vessels and triple-offset valves, whereas Canada's oil-sands operators retrofit high-temperature exchangers to lower emissions intensity. Mexican maquiladora plants, expanding under nearshoring moves, bolster medium-pressure carbon-steel vessel demand. Regional decarbonization rules further stimulate sales of advanced heat-recovery steam generators and low-NOx process heaters.
Europe exhibits mature yet stable orders geared toward efficiency upgrades and end-of-life replacements. Industrial static equipment market share growth is modest as new fossil plants remain scarce; instead, capital flows into hydrogen pilot projects, battery manufacturing facilities, and district heating expansions. German industrial clusters prioritize alloy exchangers for solvent recovery systems, while Scandinavian pulp and paper mills adopt composite digesters to mitigate corrosion. Eastern Europe benefits from EU-supported modernization funds, stimulating demand for code-stamped pressure vessels and stainless-steel sanitary valves in emerging chemical hubs.
- Flowserve Corporation
- Emerson Electric Co.
- Alfa Laval A B
- Danfoss A/S
- Mitsubishi Heavy Industries, Ltd.
- KSB SE & Co. KGaA
- Velan Inc.
- Wartsila Oyj Abp
- Johnson Controls International plc
- Xylem Inc.
- SPX FLOW, Inc.
- L&T Valves Limited
- Paul Mueller Company
- Kelvion Holding GmbH
- Hamon & Cie (International) S.A.
- Nippon Steel Engineering Co., Ltd.
- Doosan Mecatec Co., Ltd.
- IHI Power Systems Co., Ltd.
- Hitachi Zosen Corporation
- CIMC Enric Holdings Ltd.
Additional Benefits:
- The market estimate (ME) sheet in Excel format
- 3 months of analyst support
TABLE OF CONTENTS
1 INTRODUCTION
- 1.1 Study Assumptions and Market Definition
- 1.2 Scope of the Study
2 RESEARCH METHODOLOGY
3 EXECUTIVE SUMMARY
4 MARKET LANDSCAPE
- 4.1 Market Overview
- 4.2 Market Drivers
- 4.2.1 Rapid industrialization across emerging economies
- 4.2.2 Expansion of upstream oil and gas and LNG infrastructure
- 4.2.3 Capacity additions in chemicals and petrochemicals
- 4.2.4 Stricter emission norms driving heat-transfer retrofits
- 4.2.5 Hydrogen economy retrofits for high-pressure equipment
- 4.2.6 Digital-twin adoption enabling predictive maintenance
- 4.3 Market Restraints
- 4.3.1 High capital cost and shift toward renewable generation
- 4.3.2 Volatile prices of special-grade steel and alloys
- 4.3.3 Supply-chain disruptions for exotic materials
- 4.3.4 Shortage of ASME-certified skilled fabricators
- 4.4 Industry Ecosystem Analysis
- 4.5 Regulatory Landscape and Standards
- 4.6 Technological Outlook (Edge and AI analytics)
- 4.7 Porter's Five Forces Analysis
- 4.7.1 Bargaining Power of Suppliers
- 4.7.2 Bargaining Power of Buyers
- 4.7.3 Threat of New Entrants
- 4.7.4 Threat of Substitutes
- 4.7.5 Competitive Rivalry
5 MARKET SIZE AND GROWTH FORECASTS (VALUE)
- 5.1 By Equipment Type
- 5.1.1 Valves
- 5.1.1.1 Gate, Globe and Check
- 5.1.1.2 Ball Valves
- 5.1.1.3 Butterfly Valves
- 5.1.1.4 Plug Valves
- 5.1.1.5 Pressure-relief Valves
- 5.1.2 Furnaces / Boilers
- 5.1.3 Heat Exchangers
- 5.1.4 Pressure Vessels
- 5.1.1 Valves
- 5.2 By Material of Construction
- 5.2.1 Carbon Steel
- 5.2.2 Stainless Steel
- 5.2.3 Alloy Steel
- 5.2.4 Non-ferrous and Composites
- 5.3 By Pressure Rating
- 5.3.1 Low (< 300 psi)
- 5.3.2 Medium (300-900 psi)
- 5.3.3 High (> 900 psi)
- 5.4 By End-user Industry
- 5.4.1 Oil and Gas
- 5.4.2 Power Generation
- 5.4.3 Chemicals and Petrochemicals
- 5.4.4 Water and Wastewater
- 5.4.5 Mining and Metals
- 5.4.6 Food and Beverages
- 5.4.7 Other End-user Industry
- 5.5 By Geography
- 5.5.1 North America
- 5.5.1.1 United States
- 5.5.1.2 Canada
- 5.5.1.3 Mexico
- 5.5.2 Europe
- 5.5.2.1 Germany
- 5.5.2.2 United Kingdom
- 5.5.2.3 France
- 5.5.2.4 Russia
- 5.5.2.5 Rest of Europe
- 5.5.3 Asia-Pacific
- 5.5.3.1 China
- 5.5.3.2 Japan
- 5.5.3.3 India
- 5.5.3.4 South Korea
- 5.5.3.5 Australia
- 5.5.3.6 Rest of Asia-Pacific
- 5.5.4 Middle East and Africa
- 5.5.4.1 Middle East
- 5.5.4.1.1 Saudi Arabia
- 5.5.4.1.2 United Arab Emirates
- 5.5.4.1.3 Rest of Middle East
- 5.5.4.2 Africa
- 5.5.4.2.1 South Africa
- 5.5.4.2.2 Egypt
- 5.5.4.2.3 Rest of Africa
- 5.5.4.1 Middle East
- 5.5.5 South America
- 5.5.5.1 Brazil
- 5.5.5.2 Argentina
- 5.5.5.3 Rest of South America
- 5.5.1 North America
6 COMPETITIVE LANDSCAPE
- 6.1 Market Concentration
- 6.2 Strategic Moves
- 6.3 Market Share Analysis
- 6.4 Company Profiles {(includes Global level Overview, Market level overview, Core Segments, Financials as available, Strategic Information, Market Rank/Share for key companies, Products and Services, and Recent Developments)}
- 6.4.1 Flowserve Corporation
- 6.4.2 Emerson Electric Co.
- 6.4.3 Alfa Laval A B
- 6.4.4 Danfoss A/S
- 6.4.5 Mitsubishi Heavy Industries, Ltd.
- 6.4.6 KSB SE & Co. KGaA
- 6.4.7 Velan Inc.
- 6.4.8 Wartsila Oyj Abp
- 6.4.9 Johnson Controls International plc
- 6.4.10 Xylem Inc.
- 6.4.11 SPX FLOW, Inc.
- 6.4.12 L&T Valves Limited
- 6.4.13 Paul Mueller Company
- 6.4.14 Kelvion Holding GmbH
- 6.4.15 Hamon & Cie (International) S.A.
- 6.4.16 Nippon Steel Engineering Co., Ltd.
- 6.4.17 Doosan Mecatec Co., Ltd.
- 6.4.18 IHI Power Systems Co., Ltd.
- 6.4.19 Hitachi Zosen Corporation
- 6.4.20 CIMC Enric Holdings Ltd.
7 MARKET OPPORTUNITIES AND FUTURE OUTLOOK
- 7.1 White-space and Unmet-need Assessment

