
PUBLISHER: Mordor Intelligence | PRODUCT CODE: 1938996

PUBLISHER: Mordor Intelligence | PRODUCT CODE: 1938996
United States Foodservice - Market Share Analysis, Industry Trends & Statistics, Growth Forecasts (2026 - 2031)
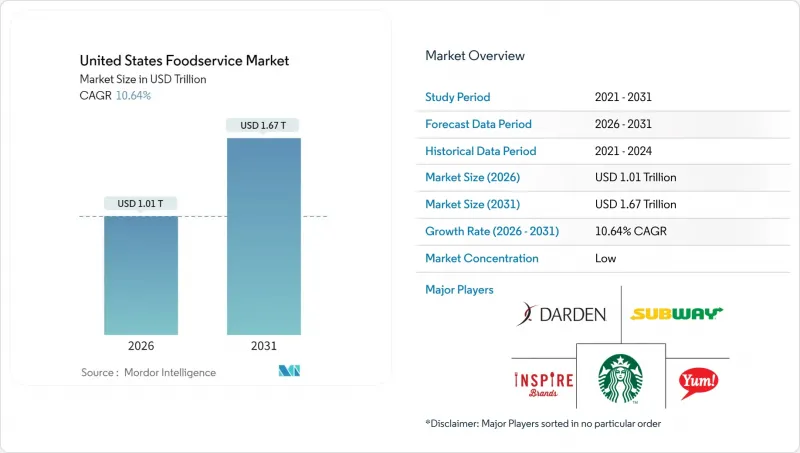
The United States foodservice restaurants market is expected to grow from USD 0.91 trillion in 2025 to USD 1.01 trillion in 2026 and is forecast to reach USD 1.67 trillion by 2031 at 10.64% CAGR over 2026-2031.
Driven by rapid digital ordering adoption, health-focused menu innovations, and a surge in capital for asset-light delivery formats, the U.S. foodservice restaurant market is witnessing notable expansion. While operators grapple with rising wage bills and fluctuating commodity prices, consumer spending on dining out is outpacing general inflation, highlighting the sector's resilience. Major chains are increasingly turning to automation and data analytics, whereas independent establishments are focusing on local sourcing and unique experiences to draw in customers. The U.S. foodservice restaurant market outlook is further bolstered by strategic franchising, the rise of suburban delivery hubs, and the widespread acceptance of contactless payments.
United States Foodservice Market Trends and Insights
Experience-Centric Dining Demand
Driven by consumer demand for immersive dining, restaurant operators are pouring investments into ambiance, tech integration, and tailored service models. This evolution underscores a post-pandemic shift: dining out has morphed from a basic need to a platform for social reconnection and rich experiences. In 2024, Starbucks Corporation committed a hefty USD 750 million to revamp its stores, enhancing experiences with features like expanded seating and community spaces, as highlighted by Starbucks Investor Relations. Data analytics are becoming a staple for restaurant operators, with 67% of full-service venues harnessing personalization tech to tailor menu suggestions and service. Casual dining and specialty restaurants, in particular, are reaping the rewards, using distinct atmospheres and curated experiences to set themselves apart. Meanwhile, FDA-mandated sanitation and food safety protocols, once seen as pandemic-era necessities, have now become standard expectations. This shift allows operators to channel their resources towards crafting unique experiences, rather than merely ensuring basic safety.
Expansion of Online Food Delivery and Contactless Services''
Digital ordering platforms and contactless payment systems transformed from pandemic necessities into permanent operational infrastructure, fundamentally altering restaurant economics and customer acquisition strategies. Third-party delivery services now account for 13.4% of total restaurant sales, with commission rates averaging 15-30% creating both revenue opportunities and margin pressures National Restaurant Association. McDonald's Corporation reported that digital channels, including mobile app orders and delivery, comprised 40% of systemwide sales in 2024, generating higher average order values and improved customer data collection capabilities. Cloud kitchen operators particularly benefit from this trend, with dedicated delivery-only facilities achieving 20-25% higher profit margins compared to traditional dine-in establishments. Contactless payment adoption reached 78% of restaurant transactions in 2024, driven by consumer preference for speed and hygiene considerations. The integration of artificial intelligence in order prediction and inventory management enables restaurants to optimize kitchen operations and reduce food waste by 15-20%.
Changing Consumer Preferences and Dietary Trends
In 2024, a notable shift in dining preferences emerged, with 23% of diners actively seeking vegetarian or vegan options, as highlighted by the National Restaurant Association. This surge in demand for plant-based proteins poses challenges for traditional meat-centric establishments, such as burger joints and steakhouses, pushing them to diversify their menus and rethink their supply chains. Furthermore, younger consumers, who account for 40% of restaurant spending, are placing a premium on sustainability and ethical sourcing. This heightened awareness is driving restaurants to be more transparent about their ingredient sourcing and environmental practices. However, this commitment to sustainability comes at a cost. Operators are grappling with rising expenses for organic, locally-sourced, and specialty dietary ingredients. These premium prices can restrict market access for some consumers. Additionally, the growing complexity of catering to varied dietary preferences and restrictions is not only challenging restaurant operations but also necessitating more extensive staff training.
Other drivers and restraints analyzed in the detailed report include:
- Drive-Thru and Self-Service Kiosks Enhancements
- Expansion of Innovative Service Models like Cloud Kitchens
- Economic Uncertainty and Inflationary Pressures
For complete list of drivers and restraints, kindly check the Table Of Contents.
Segment Analysis
Cloud kitchens are set to grow at a brisk pace of 12.35% CAGR through 2031, even as quick-service restaurants (QSRs) dominate with a hefty 49.74% market share in 2025. This upward trend underscores a shift in how consumers order food and how restaurants operate. Full-service restaurants, which offer traditional dine-in experiences, grapple with shrinking margins due to rising labor costs and a consumer shift towards convenience. However, Asian cuisine concepts in these full-service venues are holding their ground, riding a wave of growing interest in diverse and authentic flavors.
Cloud kitchens are rapidly expanding, capitalizing on their unique model of serving multiple brands from a single location, all while keeping real estate and labor costs in check. A testament to this trend is Wonder's impressive USD 950 million funding round in 2024, signaling strong investor faith in delivery-centric models that boast profit margins 20-25% higher than their traditional counterparts, as noted by PitchBook. Meanwhile, cafes and bars, especially niche coffee shops, are thriving with hybrid models that seamlessly blend traditional service and delivery. Bakeries, operating under the QSR umbrella, are harnessing automation to ensure consistent quality, catering to both in-store patrons and delivery orders. This evolution of the segment mirrors a broader industry trend towards digitization, emphasizing the critical role of technology in maintaining a competitive edge across all foodservice domains.
In 2025, independent outlets hold a 63.58% market share, but chained operations are growing at a robust 11.21% CAGR. This growth underscores the advantages of standardized systems and brand recognition. The disparity in growth rates emphasizes the scalability of franchise models, especially in markets where brand consistency and operational efficiency are paramount to consumers. Chained outlets benefit from economies of scale in areas like purchasing, marketing, and technology, giving them a competitive edge that independent operators find hard to replicate.
Franchise expansion is a boon for established brands aiming for geographic reach without heavy capital outlay. In 2024, McDonald's Corporation opened 1,100 net new locations worldwide, with a striking 95% run by franchisees, tapping into local market insights and management expertise, as highlighted by McDonald's Investor Relations. While independent outlets excel in menu flexibility, local customization, and community ties, they grapple with challenges in tech adoption and supply chain efficiency. Navigating the regulatory landscape, from FDA Food Code compliance to local health mandates, adds complexity. This is where chained operators, with their dedicated compliance teams, find an edge. Moreover, labor market trends favor chained outlets, thanks to their standardized training and career growth opportunities, leading to better employee retention.
The United States Foodservice Restaurants Market Report is Segmented by Foodservice Type (Cafes & Bars, Cloud Kitchens, Full-Service Restaurants, Quick-Service Restaurants), Outlet (Chained Outlets, Independent Outlets), Location (Leisure, Lodging, Retail, Standalone, Travel), Service Type (Dine-In, Takeaway, Delivery), and Geography (United States). The Market Forecasts are Provided in Terms of Value (USD).
List of Companies Covered in this Report:
- McDonald's Corporation
- Starbucks Corporation
- Yum! Brands Inc.
- Restaurant Brands International (RBI)
- Chipotle Mexican Grill Inc.
- Darden Restaurants Inc.
- Inspire Brands
- Bloomin' Brands
- The Wendy's Company
- Panera Bread (JAB Holding)
- Domino's Pizza Inc.
- Papa John's International
- Shake Shack Inc.
- Culver's
- Jack in the Box Inc.
- Wingstop Inc.
- Raising Cane's Chicken Fingers
- Whataburger Inc.
- Sweetgreen Inc.
- CAVA Group
Additional Benefits:
- The market estimate (ME) sheet in Excel format
- 3 months of analyst support
TABLE OF CONTENTS
1 INTRODUCTION
- 1.1 Study Assumptions and Market Definition
- 1.2 Scope of the Study
2 RESEARCH METHODOLOGY
3 EXECUTIVE SUMMARY
4 KEY INDUSTRY TRENDS
- 4.1 Number of Outlets
- 4.2 Average Order Value
- 4.3 Regulatory Framework
5 MARKET DYNAMICS
- 5.1 Market Overview
- 5.2 Market Drivers
- 5.2.1 Experience-Centric Dining Demand
- 5.2.2 Expansion of Online Food Delivery and Contactless Services
- 5.2.3 Drive-Thru and Self-Service Kiosks Enhancements
- 5.2.4 Expansion of Innovative Service Models like Cloud Kitchens
- 5.2.5 Menu Innovation and Customization
- 5.2.6 Strategic Franchise and Footprint Expansion
- 5.3 Market Restraints
- 5.3.1 Changing Consumer Preferences and Dietary Trends
- 5.3.2 Economic Uncertainty and Inflationary Pressures
- 5.3.3 Supply-Chain Volatility for Key Commodities
- 5.3.4 Rising Food and Labor Costs
- 5.4 Technological Outlook
- 5.5 Consumer Behavior Analysis
- 5.6 Porter's Five Forces
- 5.6.1 Threat of New Entrants
- 5.6.2 Bargaining Power of Buyers
- 5.6.3 Bargaining Power of Suppliers
- 5.6.4 Threat of Substitute Products
- 5.6.5 Intensity of Competitive Rivalry
6 MARKET SIZE AND GROWTH FORECASTS (VALUE)
- 6.1 By Foodservice Type
- 6.1.1 Cafes & Bars
- 6.1.1.1 Bars & Pubs
- 6.1.1.2 Cafes
- 6.1.1.3 Juice/Smoothie/Dessert Bars
- 6.1.1.4 Specialist Coffee & Tea Shops
- 6.1.2 Cloud Kitchens
- 6.1.3 Full-Service Restaurants
- 6.1.3.1 Asian
- 6.1.3.2 European
- 6.1.3.3 Latin American
- 6.1.3.4 Middle Eastern
- 6.1.3.5 North American
- 6.1.3.6 Other FSR Cuisines
- 6.1.4 Quick-Service Restaurants
- 6.1.4.1 Bakeries
- 6.1.4.2 Burger
- 6.1.4.3 Ice-cream & Frozen Treats
- 6.1.4.4 Meat-based Concepts
- 6.1.4.5 Pizza
- 6.1.4.6 Other QSR Cuisines
- 6.1.1 Cafes & Bars
- 6.2 By Outlet
- 6.2.1 Chained Outlets
- 6.2.2 Independent Outlets
- 6.3 By Location
- 6.3.1 Leisure
- 6.3.2 Lodging
- 6.3.3 Retail
- 6.3.4 Standalone
- 6.3.5 Travel
- 6.4 Service Type
- 6.4.1 Dine-in
- 6.4.2 Takeaway
- 6.4.3 Delivery
7 COMPETITIVE LANDSCAPE
- 7.1 Market Concentration
- 7.2 Strategic Moves
- 7.3 Market Share Analysis
- 7.4 Company Profiles (includes Global level Overview, Market level overview, Core Segments, Financials, Strategic Information, Market Rank/Share, Products and Services, Recent Developments)
- 7.4.1 McDonald's Corporation
- 7.4.2 Starbucks Corporation
- 7.4.3 Yum! Brands Inc.
- 7.4.4 Restaurant Brands International (RBI)
- 7.4.5 Chipotle Mexican Grill Inc.
- 7.4.6 Darden Restaurants Inc.
- 7.4.7 Inspire Brands
- 7.4.8 Bloomin' Brands
- 7.4.9 The Wendy's Company
- 7.4.10 Panera Bread (JAB Holding)
- 7.4.11 Domino's Pizza Inc.
- 7.4.12 Papa John's International
- 7.4.13 Shake Shack Inc.
- 7.4.14 Culver's
- 7.4.15 Jack in the Box Inc.
- 7.4.16 Wingstop Inc.
- 7.4.17 Raising Cane's Chicken Fingers
- 7.4.18 Whataburger Inc.
- 7.4.19 Sweetgreen Inc.
- 7.4.20 CAVA Group
8 MARKET OPPORTUNITIES AND FUTURE TRENDS

