
PUBLISHER: Mordor Intelligence | PRODUCT CODE: 2065521

PUBLISHER: Mordor Intelligence | PRODUCT CODE: 2065521
Mobile GPU - Market Share Analysis, Industry Trends & Statistics, Growth Forecasts (2026 - 2031)
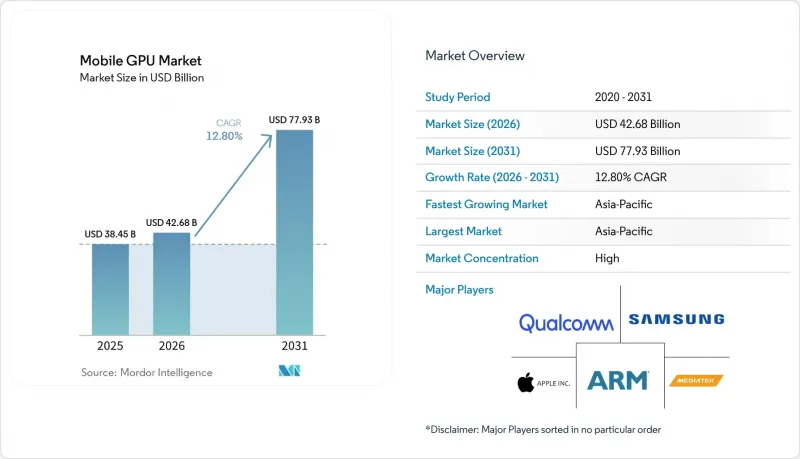
According to Mordor Intelligence, the mobile gPU market size is projected to expand from USD 38.45 billion in 2025 and USD 42.68 billion in 2026 to USD 77.93 billion by 2031, registering a CAGR of 12.8% between 2026 and 2031.
This report is Segmented by Device Type (Smartphones and Tablets), Device Price Tier (Entry-Level Devices Less Than USD 200, Mid-Range Devices USD 200 To USD 600, and More), End-User Segment (Consumer, and Enterprise), and Geography (North America, Europe, Asia-Pacific, and More). The Market Forecasts are Provided in Terms of Value (USD).
Global Mobile GPU Market Trends and Insights
Increasing Demand for Mobile Gaming Graphics Performance
Mobile gaming revenue increased in 2024, and rising session times are pressuring handset makers to deliver sustained 60 frames-per-second play without thermal throttling. MediaTek's Dimensity 9500, released in September 2025, employs the Mali-G1 Ultra GPU to boost ray-tracing throughput by 119%, allowing real-time global illumination in titles such as Genshin Impact. Strategy and role-playing install growth was in the double digits, and these genres rely on complex shader pipelines, which in turn persuade original equipment manufacturers to allocate more die area to graphics blocks. As publishers shift from hyper-casual toward hybrid-casual designs with 5-to-30-minute sessions, demand for mid-range devices that can stay within temperature limits is accelerating.
Adoption of AI Accelerators Within Mobile GPUs
SoCs now integrate neural processing units capable of 40-48 tera-operations per second, enabling night-mode photography, live translation, and generative AI effects entirely on the device. Qualcomm's Snapdragon 8 Elite Gen 5 pairs the Adreno 840 GPU with a 45-TOPS Hexagon NPU to quadruple dynamic range in imaging pipelines. Microsoft's Surface Pro 11th Edition leverages the same silicon to drive two external 4K monitors while running on-device summarization features for hybrid workforces. As designers co-locate tensor engines within GPU clusters, shared caches reduce memory contention and allow simultaneous graphics rendering and AI inference.
Thermal Constraints in Ultra-Slim Smartphone Designs
Flagship handsets are now 7-8 mm thick, so vendors sometimes disable one GPU compute unit or lower frequencies to avoid exceeding 43 °C. Samsung's hybrid pixel-binning control adds cost to the power-management integrated circuit, but without it, frame rates would collapse during ten-minute gaming sessions. Qualcomm created a seven-core Adreno variant for foldables, cutting power draw by roughly 12%. Vapor-chamber cooling adds USD 3-5 per device, squeezing margins in price-sensitive segments.
Other drivers and restraints analyzed in the detailed report include:
- Rollout of 5G Enabling High-Bandwidth Graphics Streaming
- Growth of Foldable Devices Requiring Enhanced GPU Efficiency
- Rising Smartphone ASP Pressure Limiting GPU BOM Cost
For complete list of drivers and restraints, kindly check the Table Of Contents.
Segment Analysis
Smartphones held 91.55% of the Mobile GPU market in 2025, confirming their role as the primary screen for more than 5 billion users. Multiple refresh cadences, annual for flagships, biennial for mid-tiers, sustain a steady need for incremental graphics gains that power 120 Hz OLED panels and real-time ray tracing. Tablets represent the fastest-growing slice, posting a 13.47% CAGR between 2026 and 2031 as enterprises favor 2-in-1 devices with multi-monitor support. Microsoft's Surface Pro 11th Edition couples an Adreno GPU with a 45-TOPS NPU, enabling AI captioning across two external 4K displays, evidence that tablets are graduating from consumption to workstation roles.
The smartphone sub-segment will continue to account for the bulk of the Mobile GPU market, as Qualcomm, MediaTek, and Apple shipped more than 1.2 billion SoCs in 2025. Yet commercial tablets equipped with Snapdragon X Elite are closing the performance gap with thin laptops, bringing workstation-class graphics to field technicians and creative freelancers. Apple's iPad Air with the M4 chip integrates a nine-core GPU that renders 3D scenes four times faster than the M1, underscoring the convergence of handheld and notebook compute.
Geography Analysis
Asia-Pacific accounted for 68.33% of the Mobile GPU market in 2025 and is set to grow at a 13.79% CAGR over 2026-2031. India's online gaming revenue is projected to climb by 2028, helped by 87 million additional smartphone users and nationwide 5G rollouts. China remains the largest market by installed base, though regulatory constraints are moderating its growth. Chinese chipmaker UNISOC has seized share in Africa and Southeast Asia with Mali-equipped SoCs that fit ultra-budget phones, broadening the addressable Mobile GPU market.
North America and Europe are driven by premium handsets that integrate ray tracing and 40-plus TOPS NPUs. Microsoft's enterprise push with Snapdragon X Elite laptops illustrates regional appetite for productivity-class GPUs. U.S. Bureau of Industry and Security export controls have restricted Chinese access to leading-edge GPU IP, reinforcing a bifurcated supply chain where Western consumers receive the latest architectures while Chinese brands fall back on earlier Mali cores.
South America, the Middle East, and Africa are seeing growth. Brazil's fast-growing Pix payment rails and affordable 4G handsets are helping South America's gaming revenue rise toward USD 7 billion by 2028. Gulf Cooperation Council countries are investing in esports arenas, boosting demand for high-end handsets. Nonetheless, mid-range silicon will remain dominant in these regions because purchasing power lags the global average.
- Apple Inc.
- Qualcomm Technologies, Inc.
- Arm Ltd.
- Imagination Technologies Ltd.
- Samsung Electronics Co., Ltd.
- MediaTek Inc.
- Advanced Micro Devices, Inc.
- Nvidia Corporation
- Huawei Technologies Co., Ltd. (HiSilicon)
- UNISOC (Shanghai) Technologies Co., Ltd.
- VeriSilicon Holdings Co., Ltd.
- Vivante Corporation (Cadence Design Systems, Inc.)
- Silicon Integrated Systems Corp.
- Google LLC
- Oppo Guangdong Mobile Communications Co., Ltd. (MariSilicon)
- Xiaomi Corporation
Additional Benefits:
- The market estimate (ME) sheet in Excel format
- 3 months of analyst support
TABLE OF CONTENTS
1 INTRODUCTION
- 1.1 Study Assumptions and Market Definition
- 1.2 Scope of the Study
2 RESEARCH METHODOLOGY
3 EXECUTIVE SUMMARY
4 MARKET LANDSCAPE
- 4.1 Market Overview
- 4.2 Market Drivers
- 4.2.1 Increasing Demand for Mobile Gaming Graphics Performance
- 4.2.2 Adoption of AI Accelerators Within Mobile GPUs
- 4.2.3 Rollout of 5G Enabling High-Bandwidth Graphics Streaming
- 4.2.4 Growth of Foldable Devices Requiring Enhanced GPU Efficiency
- 4.2.5 Mainstream Integration of Ray Tracing Capabilities
- 4.2.6 Rising Developer Adoption of Vulkan and Metal APIs
- 4.3 Market Restraints
- 4.3.1 Thermal Constraints in Ultra-Slim Smartphone Designs
- 4.3.2 Rising Smartphone ASP Pressure Limiting GPU BOM Cost
- 4.3.3 Export Controls on Advanced Semiconductor IP
- 4.3.4 Patent Litigation Risks Among IP Licensors
- 4.4 Impact of Macroeconomic Factors on the Market
- 4.5 Industry Value-Chain Analysis
- 4.6 Regulatory Landscape
- 4.7 Technological Outlook
- 4.8 Porter's Five Forces Analysis
- 4.8.1 Threat of New Entrants
- 4.8.2 Bargaining Power of Buyers
- 4.8.3 Bargaining Power of Suppliers
- 4.8.4 Threat of Substitute Products
- 4.8.5 Intensity of Competitive Rivalry
- 4.9 Pricing Analysis
5 MARKET SIZE AND GROWTH FORECASTS (VALUE)
- 5.1 By Device Type
- 5.1.1 Smartphones
- 5.1.2 Tablets
- 5.2 By Device Price Tier
- 5.2.1 Entry-Level Devices (Less Than USD 200)
- 5.2.2 Mid-Range Devices (USD 200-USD 600)
- 5.2.3 Premium Devices (Greater Than USD 600)
- 5.3 By End-User Segment
- 5.3.1 Consumer
- 5.3.2 Enterprise / Commercial
- 5.4 By Geography
- 5.4.1 North America
- 5.4.1.1 United States
- 5.4.1.2 Canada
- 5.4.1.3 Mexico
- 5.4.2 Europe
- 5.4.2.1 Germany
- 5.4.2.2 United Kingdom
- 5.4.2.3 France
- 5.4.2.4 Rest of Europe
- 5.4.3 Asia-Pacific
- 5.4.3.1 China
- 5.4.3.2 Japan
- 5.4.3.3 South Korea
- 5.4.3.4 India
- 5.4.3.5 Rest of Asia-Pacific
- 5.4.4 South America
- 5.4.5 Middle East and Africa
- 5.4.1 North America
6 COMPETITIVE LANDSCAPE
- 6.1 Market Concentration
- 6.2 Strategic Moves
- 6.3 Market Share Analysis
- 6.4 Company Profiles (includes Global Level Overview, Market Level Overview, Core Segments, Financials as available, Strategic Information, Market Rank/Share, Products and Services, Recent Developments)
- 6.4.1 Apple Inc.
- 6.4.2 Qualcomm Technologies, Inc.
- 6.4.3 Arm Ltd.
- 6.4.4 Imagination Technologies Ltd.
- 6.4.5 Samsung Electronics Co., Ltd.
- 6.4.6 MediaTek Inc.
- 6.4.7 Advanced Micro Devices, Inc.
- 6.4.8 Nvidia Corporation
- 6.4.9 Huawei Technologies Co., Ltd. (HiSilicon)
- 6.4.10 UNISOC (Shanghai) Technologies Co., Ltd.
- 6.4.11 VeriSilicon Holdings Co., Ltd.
- 6.4.12 Vivante Corporation (Cadence Design Systems, Inc.)
- 6.4.13 Silicon Integrated Systems Corp.
- 6.4.14 Google LLC
- 6.4.15 Oppo Guangdong Mobile Communications Co., Ltd. (MariSilicon)
- 6.4.16 Xiaomi Corporation
7 MARKET OPPORTUNITIES AND FUTURE OUTLOOK
- 7.1 White-Space and Unmet-Need Assessment

